녹내장 정도에 따라 망막전막이 망막신경섬유층, 신경절세포층, 황반부 두께에 미치는 영향
Effect of ERM on RNFL, GCIPL and Macular Thickness According to the Severity of Glaucoma
Article information
Abstract
목적
파장가변 빛간섭단층촬영을 이용하여 망막전막이 녹내장 환자의 시신경유두 주위 망막신경섬유층 두께(peripapillary retinal nerve fiber layer thickness, pRNFLT)와 황반부 신경절세포 및 내망상층 두께(macular ganglion cell-inner plexiform layer thickness, mGCIPLT), 황반부 두께(macular thickness, MT)에 미치는 영향을 알아보고, 녹내장 중등도에 따라 차이가 있는지 확인해 보고자 한다.
대상과 방법
녹내장 환자 중 망막전막을 진단받은 105명 중 105안을 망막전막이 없는 녹내장 환자와 연령, 성별, 백내장수술 여부, 안축장 길이, 시야검사의 mean deviation을 기준으로 일대일 매칭하였다. 두 군을 대상으로 pRNFLT, mGCIPLT 그리고 MT 차이를 확인하였으며, 녹내장 중등도에 따라 세 그룹으로 나누어 비교하였다.
결과
망막전막이 있는 녹내장군은 전체 환자군에서 평균, 이측, 7-11시 pRNFLT 영역에서 망막전막이 없는 군에 비해 두껍게 측정되었다. 모든 녹내장 중등도에서 망막전막이 있는 군이 없는 군에 비해 mGCIPLT, MT가 모든 영역에서 두껍게 측정되었다. 중기 녹내장군에서 초기 녹내장군보다 pRNFLT의 7시, 11시 영역에서 두 군 사이의 두께 차이가 유의하게 컸다(각각 p=0.043, p=0.012).
결론
망막전막은 pRNFLT, mGCIPLT, MT에 영향을 주며, 녹내장의 중등도에 따라 망막전막이 pRNFLT에 미치는 영향의 정도는 다르다.
Trans Abstract
Purpose
To investigate the effect of an epiretinal membrane (ERM) on peripapillary retinal nerve fiber layer thickness (pRNFLT), macular ganglion cell-inner plexiform layer thickness (mGCIPLT) and macular thickness (MT) in relation to glaucoma severity using swept-source optical coherence tomography (SS-OCT).
Methods
In total, 105 eyes of 105 glaucoma patients with ERM were matched at a 1:1 ratio with glaucoma patients without ERM according to age, sex, cataract surgery, axial length and mean deviation based on visual field tests. The differences in pRNFLT, mGCIPLT and MT between the two groups were assessed using SS-OCT. Furthermore, the patients were divided into three glaucoma-severity groups, and the differences in pRNFLT, mGCIPLT and MT were compared between glaucoma patients with and without ERM in each group.
Results
In all patients, including those with early, moderate, and advanced glaucoma, those with ERM had greater average, temporal quadrant, and 7, 8, 9, 10, and 11 o’clock pRNFLT values compared to those without ERM. Additionally, mGCIPLT and MT were thicker in glaucoma patients with ERM in all groups. The difference in pRNFLT at the 7 and 11 o’clock positions between glaucoma patients with and without ERM was significantly more pronounced in the moderate glaucoma group than in the early glaucoma group (p = 0.043 and p = 0.012, respectively).
Conclusions
ERM has notable effects on the pRNFLT, mGCIPLT and MT. Furthermore, the magnitude of its effect on pRNFLT varies with glaucoma severity.
망막전막은 내경계막 표면에 섬유세포막이 형성되는 것으로, 지속적인 견인력을 일으켜 황반의 미세구조를 손상시킨다.1-3 이러한 망막 구조의 변화는 환자들에게 변형시 및 시력저하 증상을 야기시킨다.4,5 녹내장 진단에 있어서 망막신경섬유층(retinal nerve fiber layer, RNFL) 및 신경절세포층(ganglion cell layer) 등의 해부학적 손상에 의한 구조적 변화를 감지하기 위해 빛간섭단층촬영(optical coherence tomography, OCT) 장비가 널리 사용되고 있으며, 이는 황반부와 RNFL 두께 측정을 통해 녹내장 환자를 진단하고 진행 정도를 파악하는 데 도움을 주고 있다.6-8
OCT 검사에서도 오차가 생길 가능성은 존재하므로, 여러 논문에서 반복촬영을 통해 어떠한 질환에서 오차가 주로 생기는지 스펙트럼 빛간섭단층촬영(spectral-domain OCT, SD-OCT)을 이용해 분석해왔다. 이들 연구에서는 고도근시, 황반변성, 망막전막, 유리체황반견인 등이 동반될 경우 오차가 발생할 수 있음을 확인하였으며, 망막전막은 가장 주요한 요인이었다.9,10 SD-OCT를 이용하여 망막전막이 시신경유두 주위 망막신경섬유층 두께(peripapillary retinal nerve fiber layer thickness, pRNFLT)와 황반부 신경절세포층 두께(macular ganglion cell layer thickness, mGCLT)에 미치는 영향을 분석한 논문도 발표되었는데, 일반적으로 망막전막이 pRNFLT의 이측 부위와 mGCLT 모든 영역을 두껍게 만드는 것으로 나타났다.11-13 최근에는 SD-OCT보다 더 긴 파장을 사용하여 높은 침투력을 가진 파장가변 빛간섭단층촬영(swept-source OCT, SS-OCT)을 이용하여 망막전막의 영향을 연구한 논문들이 발표되었다. 하지만 현재까지 녹내장의 중등도에 따라 망막전막이 미치는 영향이 다른지에 대한 연구는 없었다.
이에 본 연구는 SS-OCT를 이용하여 망막전막이 녹내장 환자들의 pRNFLT, 황반부 신경절세포 및 내망상층 두께(macular ganglion cell-inner plexiform layer thickness, mGCIPLT), 황반부 두께(macular thickness, MT)에 미치는 영향을 파악해보고자 한다. 또한 녹내장의 중등도에 따라 차이가 있는지 분석해보고자 한다.
대상과 방법
본 연구는 2018년 1월부터 2023년 1월까지 중앙보훈병원 안과를 방문한 원발개방각녹내장 환자 중 망막전막을 진단받은 환자를 대상으로 의무기록을 후향적으로 분석하여 진행하였다. 모든 환자들은 세극등현미경검사, 안압검사, 최대교정시력, 안저검사, 시신경유두검사, 초음파를 이용한 중심각막두께 측정(SP-3000, Tomey Corp., Nagoya, Japan), 안축장 측정(IOL Master 700, Carl Zeiss Meditec, Jena, Germany), Humprey field analyzer (model 750, Carl Zeiss Meditec)의 central 24-2 Swedish interactive threshold algorithm standard strategy를 이용한 시야검사, 파장가변 빛간섭단층촬영(DRI OCT Triton, Topcon Corp., Tokyo, Japan)을 시행하였으며, DRI OCT를 통해 pRNFLT, mGCIPLT 그리고 MT 측정을 시행하였다. 녹내장 환자들은 시야검사의 mean deviation (MD) 값을 기준으로 하여 초기(MD≥-6 dB), 중기(-6 dB>MD≥-12 dB), 말기(MD<-12 dB)의 세 군으로 분류하였다. 연구 기간에 녹내장 외래를 내원한 전체 환자들 중 망막전막을 동반한 녹내장 환자들을 분류하고 선별 기준에 해당하며 배제 기준에는 해당하지 않는 환자들을 선정하였다. 이후 이와 비교를 하기 위해 망막전막이 없는 녹내장 환자들을 성별, 연령, 백내장수술 여부, 안축장 길이, MD에 따라 일대일로 무작위로 배정하여 매칭하였다. 매칭 기준은 성별이 동일하고 연령 차이가 5살 이하, MD 차이가 3 dB 이하, 안축장 길이 차이가 1.0 mm 이하, 백내장수술 여부가 동일한 것을 기준으로 하였다.
녹내장 환자들은 녹내장성 시신경 손상을 보이며 시야검사에서 녹내장성 결손을 보이는 경우로 정의하였다. 녹내장성 시야결손은 두 번 이상의 연속적인 검사를 시행하였을 때 pattern deviation plot에서 활모양 영역에 있는 3개 이상의 점의 역치가 정상의 5% 미만으로 나타나면서 그중 한 개 이상은 1% 미만이거나 glaucoma hemifield test에서 이상 소견(outside normal limit)을 보일 때, 혹은 pattern standard deviation (PSD)이 5% 미만일 경우로 정의하였다. 시야검사의 신뢰도를 위해 주시 상실 20% 이상 또는 위양성률과 위음성률이 15% 이상인 경우는 대상에서 제외하였다.
포도막염에 의한 녹내장, 스테로이드 유발 녹내장, 신생혈관녹내장 등의 이차 녹내장 환자, 단순 백내장수술을 제외한 안내 수술 과거력이 있는 환자, 당뇨망막병증 및 연령관련황반변성 등의 망막 질환 환자, 교정시력이 0.5 이하인 경우 및 -6 diopters (D) 이상의 고도근시가 있는 경우, 파장가변 빛간섭단층촬영에서 image quality가 40 미만이 경우도 연구 대상에서 제외하였다.
pRNFLT, mGCIPLT, MT 측정은 SS-OCT를 이용하여 숙달된 검사자가 진행하였다. pRNFLT 및 mGCIPLT는 Rescan 3D wide 프로토콜을 이용하여 측정하였다. 시신경 유두를 중심으로 가로 12.0 mm, 세로 9.0 mm 사각형 부위를 512 A×256 B (512회의 A-scan, 256회의 B-scan) 스캔하였으며, 이후 직경 3.4 mm 원의 평균, 사분면 그리고 12시간 영역의 pRNFLT 및 직경 6 mm 원의 여섯 개의 영역으로 나눠진 mGCIPLT 측정값을 얻었다(Fig. 1). MT는 Rescan 3D Macula 프로토콜을 사용하였다. 가로 7.0 mm, 세로 7.0 mm 사각형 부위를 512 A×256 B (512회의 A-scan, 256회의 B-scan) 스캔하였으며, Early Treatment of Diabetic Retinopathy Study (ETDRS) subfield로 구분된 9개 구역(중심와를 기준으로 1 mm, 3 mm, 6 mm 직경 3개의 동심을 만들고 중심부, 안쪽 원, 바깥쪽 원으로 구분)의 MT를 측정하였다(Fig. 1). 망막전막의 존재 유무는 SS-OCT에서 망막표면에 고반사 선이 관찰되거나 혹은 내망막층 표면이 찌그러지거나 주름 소견이 동반될 때 망막전막이 존재하는 것으로 판단하였다.1,14,15 망막전막이 황반부뿐만 아니라 pRNFLT의 측정 범위인 직경 3.4 mm 원 이내에 존재하는 경우에 연구 대상에 포함하였고, 망막전막은 Govetto et al1이 제시한 등급에 따라 총 4단계로 분류하였다. 1단계는 망막층의 형태 변화와 중심오목 소실이 없는 상태, 2단계는 망막층의 형태 변화는 없으나 중심오목의 소실이 있는 상태, 3단계는 중심오목 소실이 있으면서 이소성의 망막 내층(ectopic inner foveal layer)이 존재할 때, 4단계는 중심오목 소실, 이소성의 망막 내층이 있으면서 망막층 간의 경계가 소실될 경우로 정의하였다.
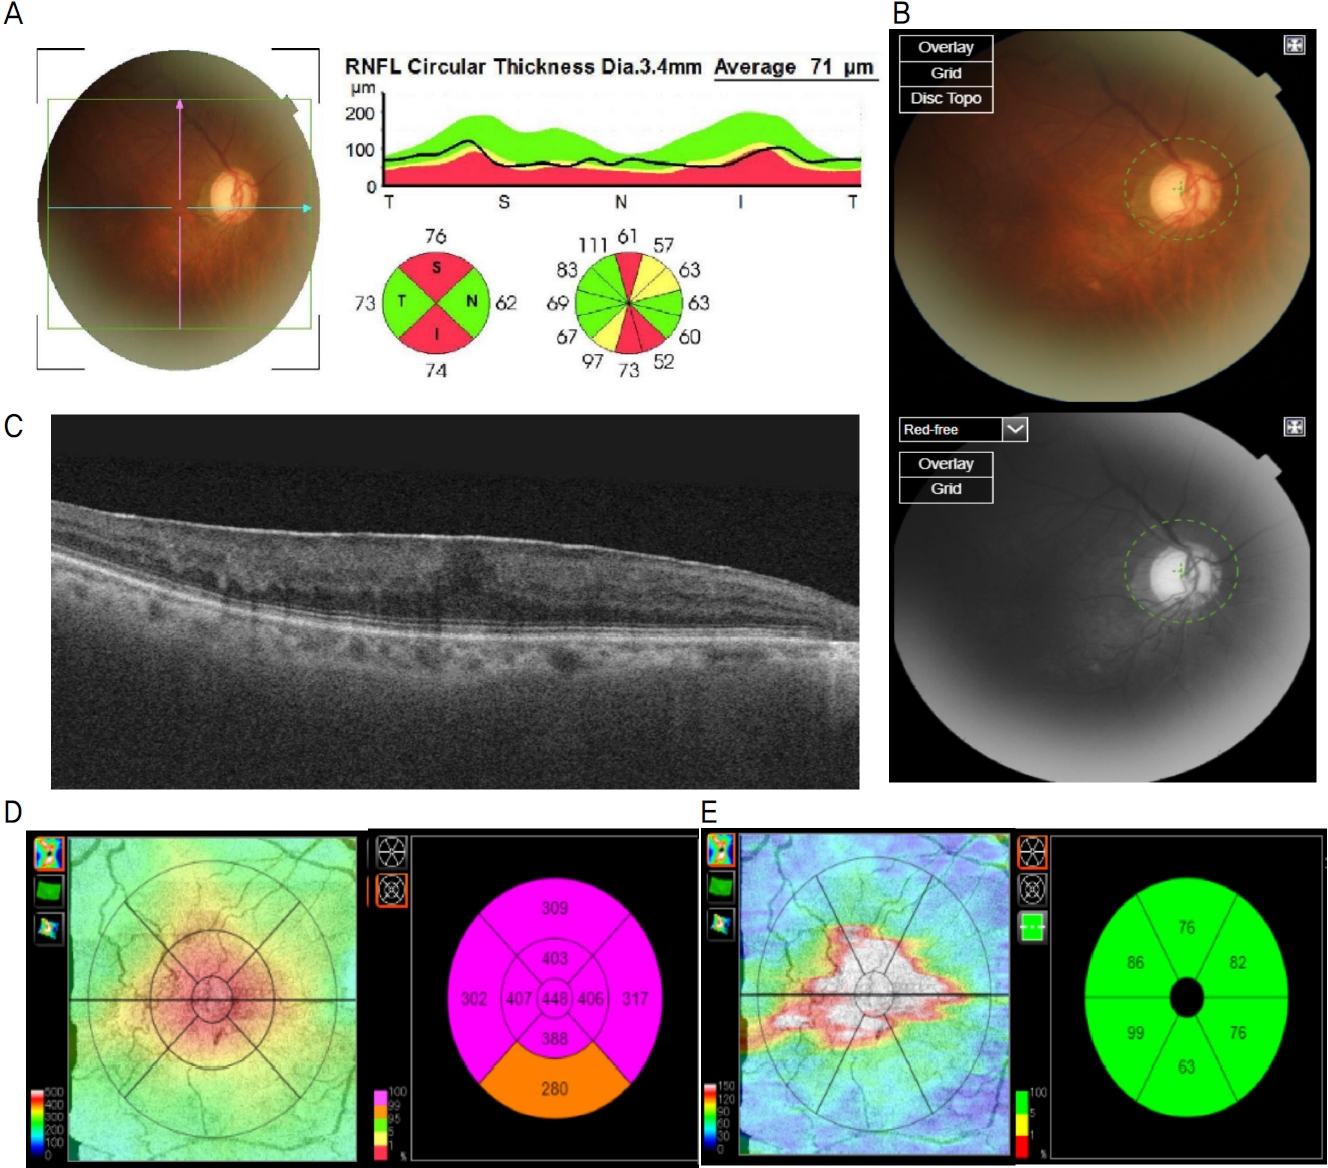
Representative case of a 83-year-old male patient with primary open angle glaucoma and epiretinal membrane. (A) pRNFLT measurement by using SS-OCT Rescan 3D wide protocol. (B) The circle line shows scan area of 3.4 mm diameter which is helpful to detection of peripapillary involvement. (C) OCT image of SS-OCT Rescan 3D macula protocol. W e can see peripapillary involvement within the circle line when referring to (B). (D) MT measurement by using SS-OCT Rescan 3D macula protocol in IMAGEnet6 software. (E) mGCIPLT measurement by using SS-OCT Rescan 3D wide protocol in IMAGEnet6 software. pRNFLT = peripapillary retinal nerve fiber layer thickness; SS = swept source; OCT = optical coherence tomography; MT = macular thickness; mGCIPLT = macular ganglion cell-inner plexiform layer thickness.
통계적 분석은 SPSS version 20.0 (IBM Corp., Armonk, NY, USA)을 이용하였다. 망막전막의 유무에 따른 녹내장 군의 임상적 특성과 검사 계측치 비교를 위해 독립표본 t검정(independent t-test) 및 카이제곱검정(chi-squared test)을 시행하였다. 망막전막이 있는 녹내장군과 망막전막이 없는 녹내장군의 pRNFLT, mGCIPLT 및 MT 비교를 위해 대응 표본 t검정(paired t-test)을 실시하였다. 망막전막이 있는 녹내장군과 망막전막이 없는 녹내장군의 pRNFLT, mGCIPLT 및 MT 차이가 녹내장 중등도에 따라 유의한 차이가 있는지 확인을 위해 일원배치 분산분석(one-way analysis of variance, one-way ANOVA)을 이용하였으며, 사후분석은 Bonferroni method을 사용하였다. 모든 통계 분석에서 p-value가 0.05 미만인 경우 통계적으로 유의성이 있다고 분석하였다. 본 연구는 헬싱키선언(Declaration of Helsinki)을 준수하였으며 본원의 연구윤리심의위원회(Institutional Review Board, IRB)의 승인을 받았다(승인 번호: 2023-04-018).
결 과
망막전막을 진단받은 원발개방각녹내장 환자 총 105명 중 105안이 포함되었다. 이 중 초기 녹내장은 40명 40안, 중기 녹내장은 33명 33안, 말기 녹내장은 32명 32안으로 분류되었다. 또한 망막전막이 없는 원발개방각녹내장 환자 105명 105안이 비교를 위해 일대일 매칭되어 연구 대상으로 등록되었으며, 녹내장 중등도에 따른 구성도 망막전막이 있는 녹내장군과 동일하였다.
망막전막이 있는 군과 망막전막이 없는 군에서 연령, 성별, 기저 질환 여부, 사용 중인 녹내장 점안제의 개수, 안축장 및 중심각막두께, 안압, 최대교정시력, 시야검사 결과에 있어서 통계적으로 유의한 차이가 없었다(Table 1). 망막전막은 1단계 37안, 2단계 49안, 3단계 14안, 4단계 5안으로 분류되었다. 망막전막이 있는 녹내장 환자를 초기, 중기, 말기 녹내장으로 분류한 세 군으로 비교한 결과, 연령, 안축장, 중심각막두께, 안압, 최대교정시력, 망막전막 단계 분포에는 유의한 차이가 없었다(Table 2). 그러나 녹내장 점안제의 개수, 시야검사 결과인 MD, PSD, visual field index(VFI)에서는 유의한 차이를 보였다(all p<0.001, one-way ANOVA) (Table 2).
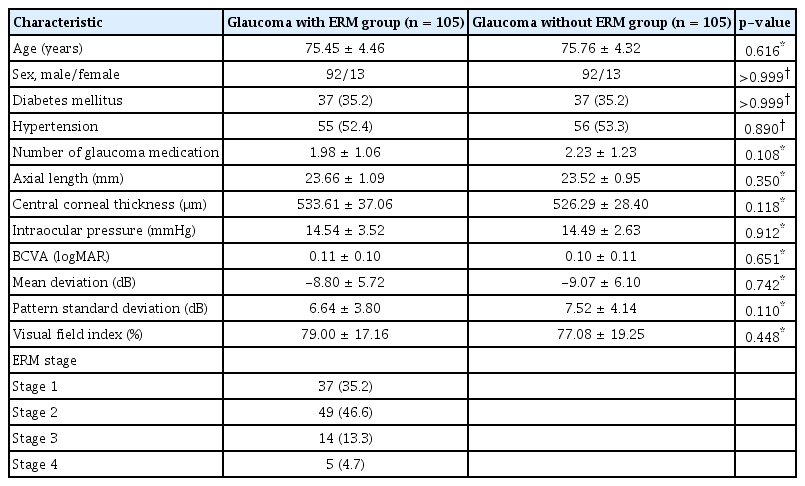
Demographic and clinical characteristics of study population

Comparison of demographic and clinical characteristics among glaucoma groups with ERM
전체 105명의 녹내장 환자를 대상으로 하여 망막전막이 있는 군과 없는 군에서 pRNFLT를 평균과 사분면, 12시간 영역으로 나누어 비교하였다. 망막전막이 있는 군에서 pRNFLT가 평균, 이측, 7시, 8시, 9시, 10시, 11시 영역에서 통계적으로 유의하게 두껍게 측정되었다(각각 p<0.001, p<0.001, p=0.004, p<0.001, p<0.001, p<0.001 and p=0.025, paired t-test) (Table 3). mGCIPLT의 평균 및 모든 영역, ETDRS subfield로 구분된 9개의 MT 영역 모두 망막전막이 있는 군에서 유의하게 두껍게 측정되었다(all p<0.001, paired t-test) (Table 3).
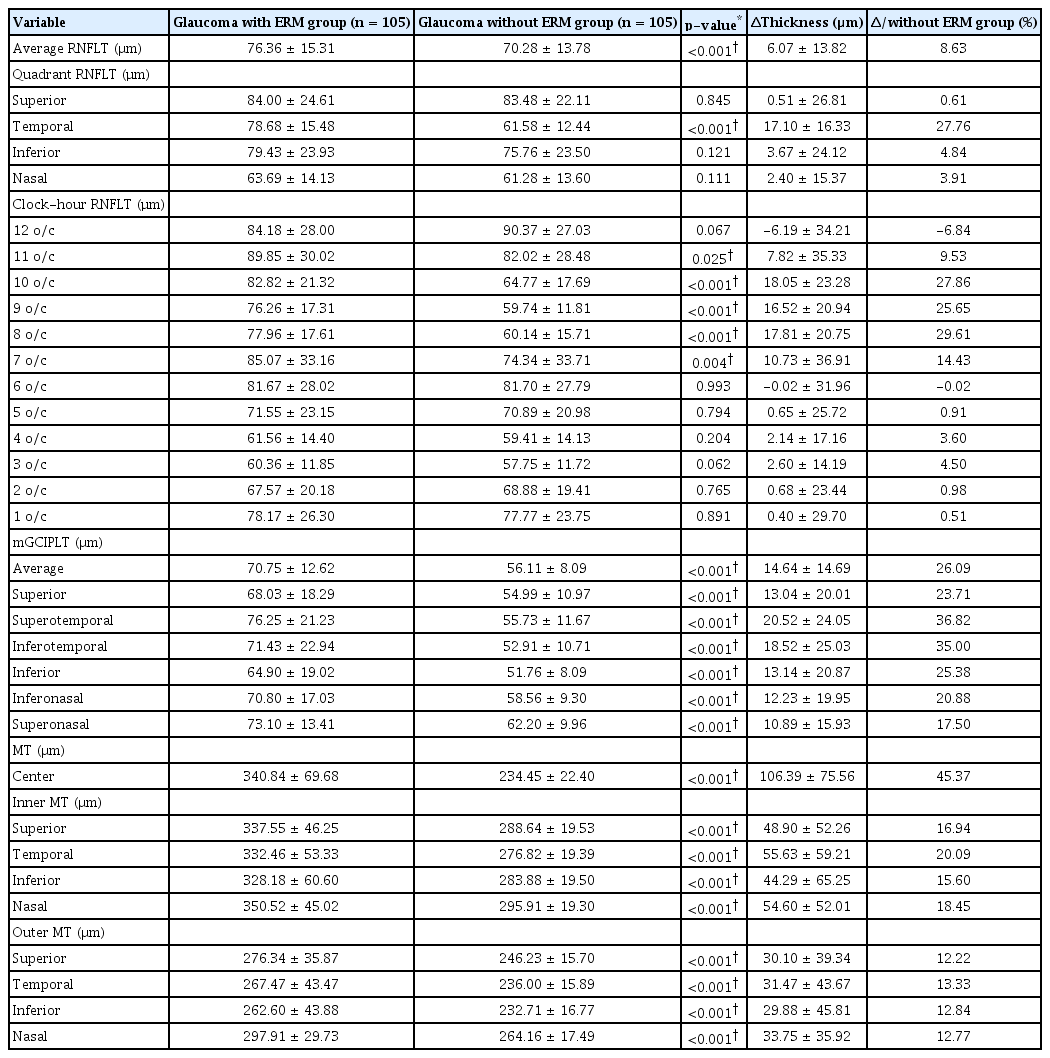
Comparison of the pRNFLT, mGCIPL and MT between glaucoma with ERM group and glaucoma without ERM group
초기 녹내장군에서는 망막전막이 있을 경우 pRNFLT가 평균, 이측, 8시, 9시, 10시 영역에서 두껍게 측정되었다(각각 p=0.037, p<0.001, p<0.001, p=0.001 and p=0.001, paired t-test) (Table 4). mGCIPLT의 평균 및 모든 영역, ETDRS subfield로 구분된 9개의 MT 영역 모두 망막전막이 있는 군에서 두껍게 측정되었다(all p<0.05, paired t-test) (Table 4).
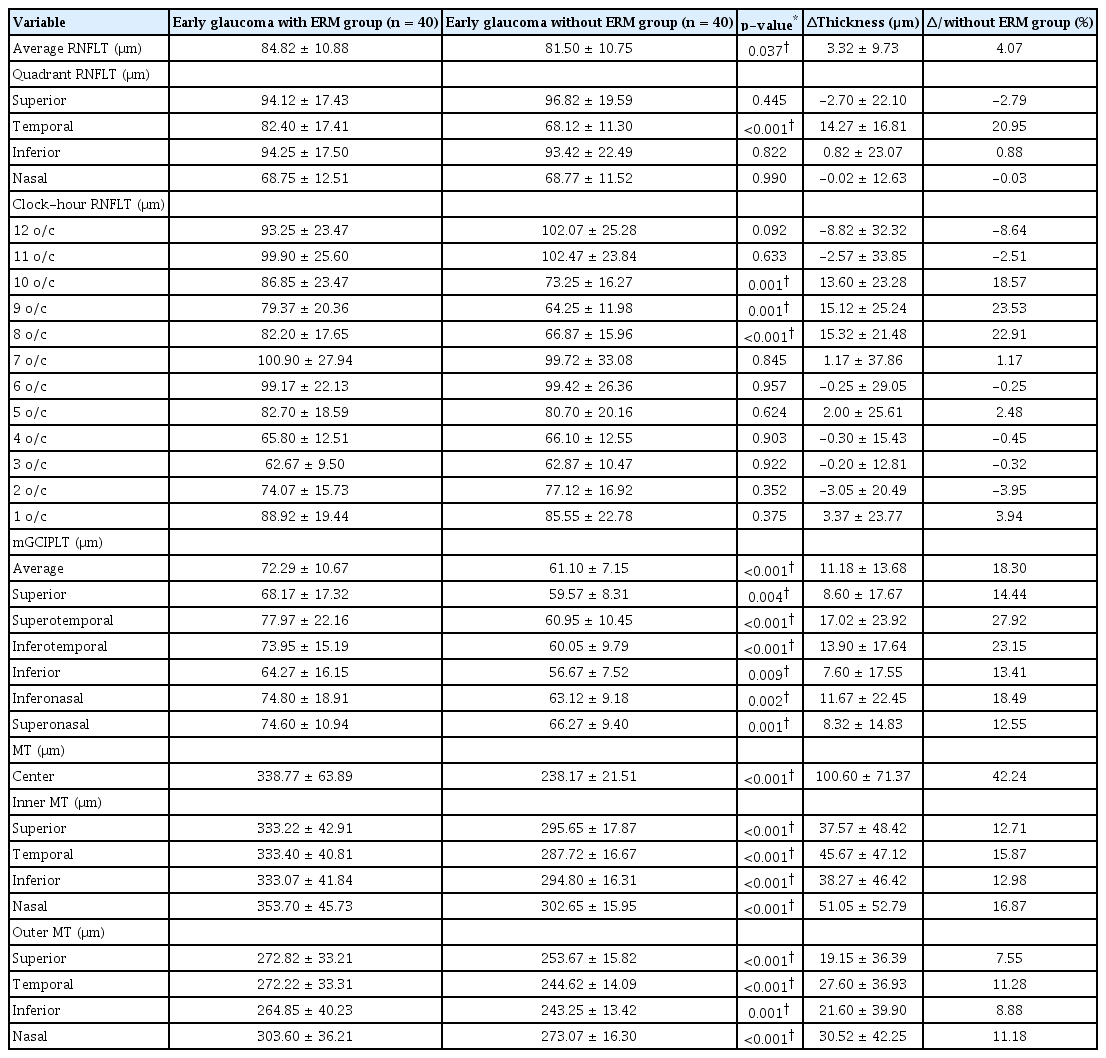
Comparison of the pRNFLT, mGCIPLT and MT between glaucoma with ERM group and glaucoma without ERM group (early stage)
중기 녹내장군에서는 망막전막이 있을 경우 pRNFLT가 평균, 이측, 7시, 8시, 9시, 10시, 11시 영역에서 두껍게 측정되었다(각각 p<0.001, p<0.001, p=0.001, p<0.001, p<0.001, p<0.001 and p=0.001, paired t-test) (Table 5). mGCIPLT의 평균 및 모든 영역, ETDRS subfield로 구분된 9개의 MT 영역 모두 망막전막이 있는 군에서 두껍게 측정되었다(all p<0.05, paired t-test) (Table 5).

Comparison of the pRNFLT, mGCIPLT and MT between glaucoma with ERM group and glaucoma without ERM group (moderate stage)
말기 녹내장군에서는 망막전막이 있을 경우 pRNFLT가 이측, 8시, 9시, 10시 영역에서 두껍게 측정되었다(각각 p<0.001, p<0.001, p<0.001 and p=0.001, paired t-test) (Table 6). mGCIPLT의 평균 및 모든 영역, ETDRS subfield로 구분된 9개의 MT 영역 모두 망막전막이 있는 군에서 두껍게 측정되었다(all p<0.001, paired t-test) (Table 6).
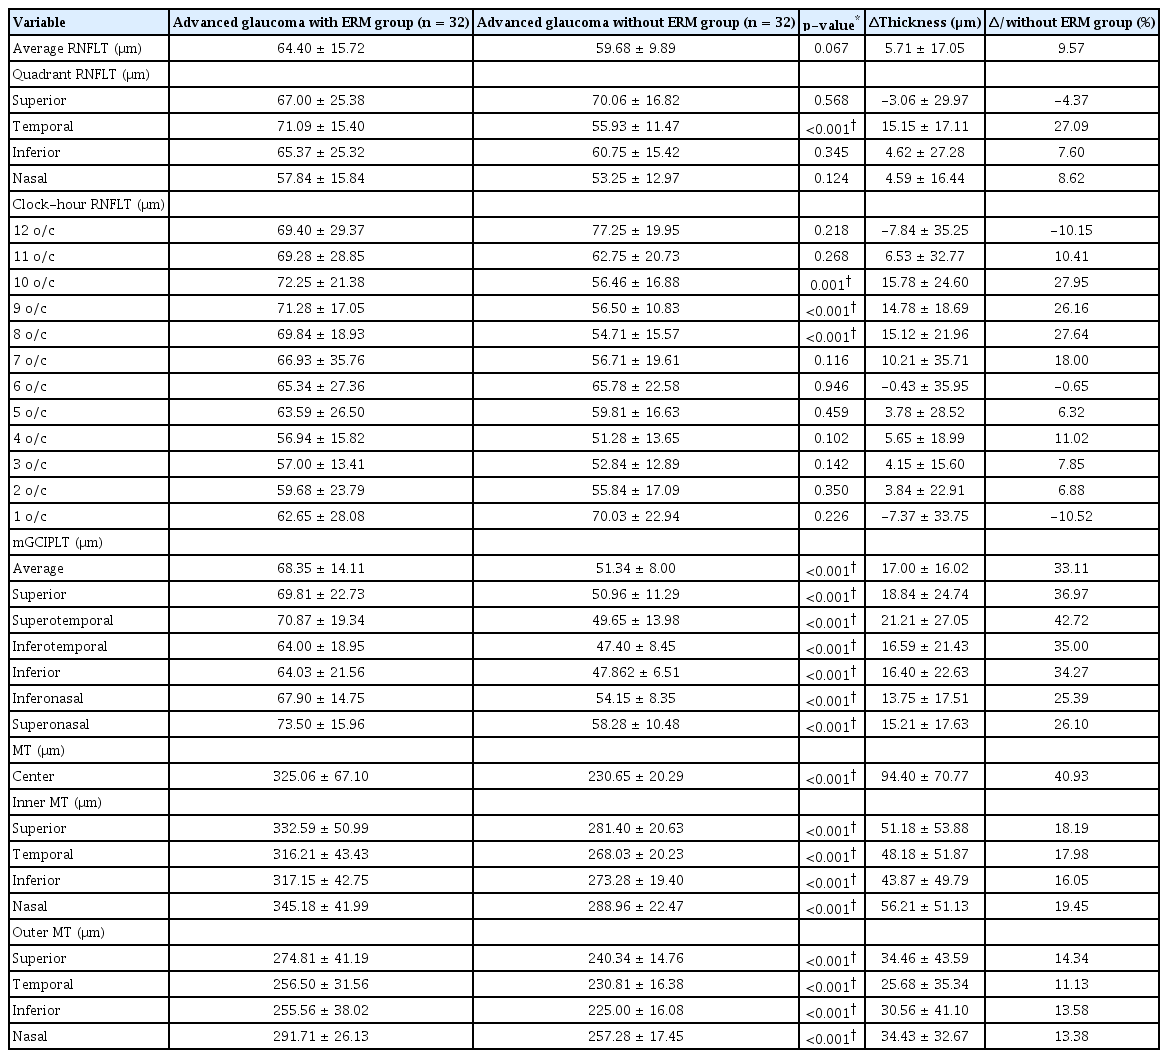
Comparison of the pRNFLT, mGCIPLT and MT between glaucoma with ERM group and glaucoma without ERM group (advanced stage)
각각의 녹내장 중증도군에서 망막전막이 있는 환자와 없는 환자의 pRNFLT, mGCIPLT와 MT 차이를 비교해보았다. 망막전막이 있는 군과 없는 군의 차이는 7시 pRNFLT 영역 부위를 보면, 초기 녹내장군에서 1.17 ± 37.86, 중기 녹내장에서 22.81 ± 34.35, 말기 녹내장에서 10.21 ± 35.71로 측정되었으며, 세 군의 차이는 통계적으로 유의하였다(p=0.043, one-way ANOVA) (Table 7). 이를 사후분석을 통해 확인한 결과, 중기 녹내장군이 초기 녹내장군보다 차이가 유의하게 큰 것으로 나타났다(p=0.037, Bonferroni method) (Table 7). 11시 pRNFLT 영역에서 망막전막이 있는 군과 없는 군의 차이는 초기 녹내장군에서 -2.57 ± 33.85, 중기 녹내장에서 21.69 ± 35.85, 말기 녹내장에서 6.53 ± 32.77로 측정되었으며, 세 군의 차이는 통계적으로 유의하였다(p=0.012, one-way ANOVA) (Table 7). 이를 사후분석을 통해 확인한 결과, 중기 녹내장군이 초기 녹내장군보다 차이가 유의하게 큰 것으로 나타났다(p=0.010, Bonferroni method) (Table 7).
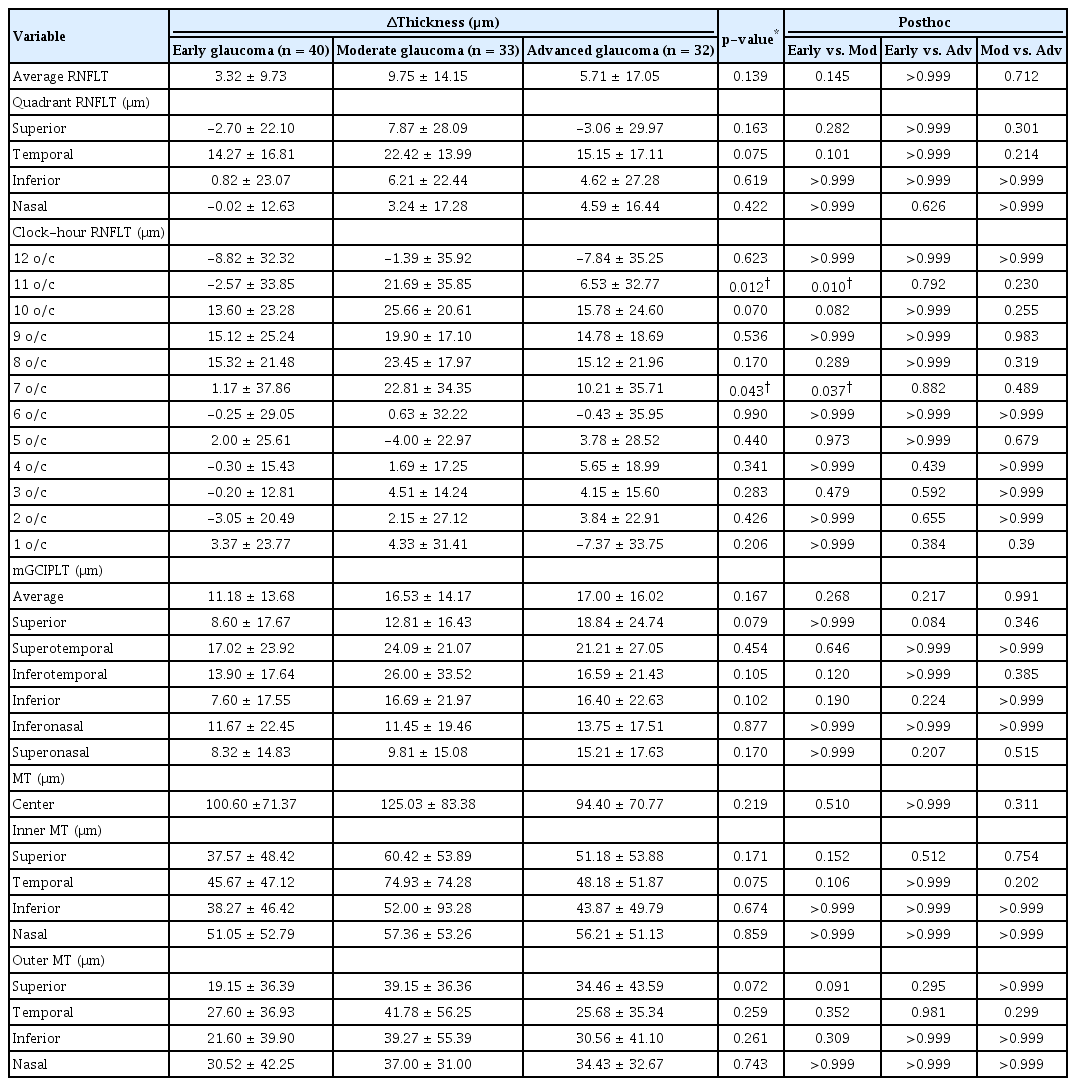
Comparison of differences in the pRNFLT, mGCIPLT and MT between glaucoma with ERM group and glaucoma without ERM group according to the severity of glaucoma
망막전막이 있는 군과 없는 군의 mGCIPLT, MT 차이 부분에서는 녹내장 정도에 따라 유의한 차이가 나타나지 않았다(Table 7). 망막전막이 있는 녹내장 환자와 망막전막이 없는 녹내장 환자를 제시한 기준에 맞게 매칭하여 pRNFLT, MT, mGCIPLT 및 시야검사 결과를 비교한 예시를 Fig. 2로 제시하였다. 두 환자의 경우 시야검사의 MD와 PSD를 감안할 때 비슷한 녹내장 정도를 갖고 있으나, 망막전막 있는 경우 이측 pRNFLT, MT와 mGCIPLT의 대부분 영역이 두꺼움을 확인할 수 있다.
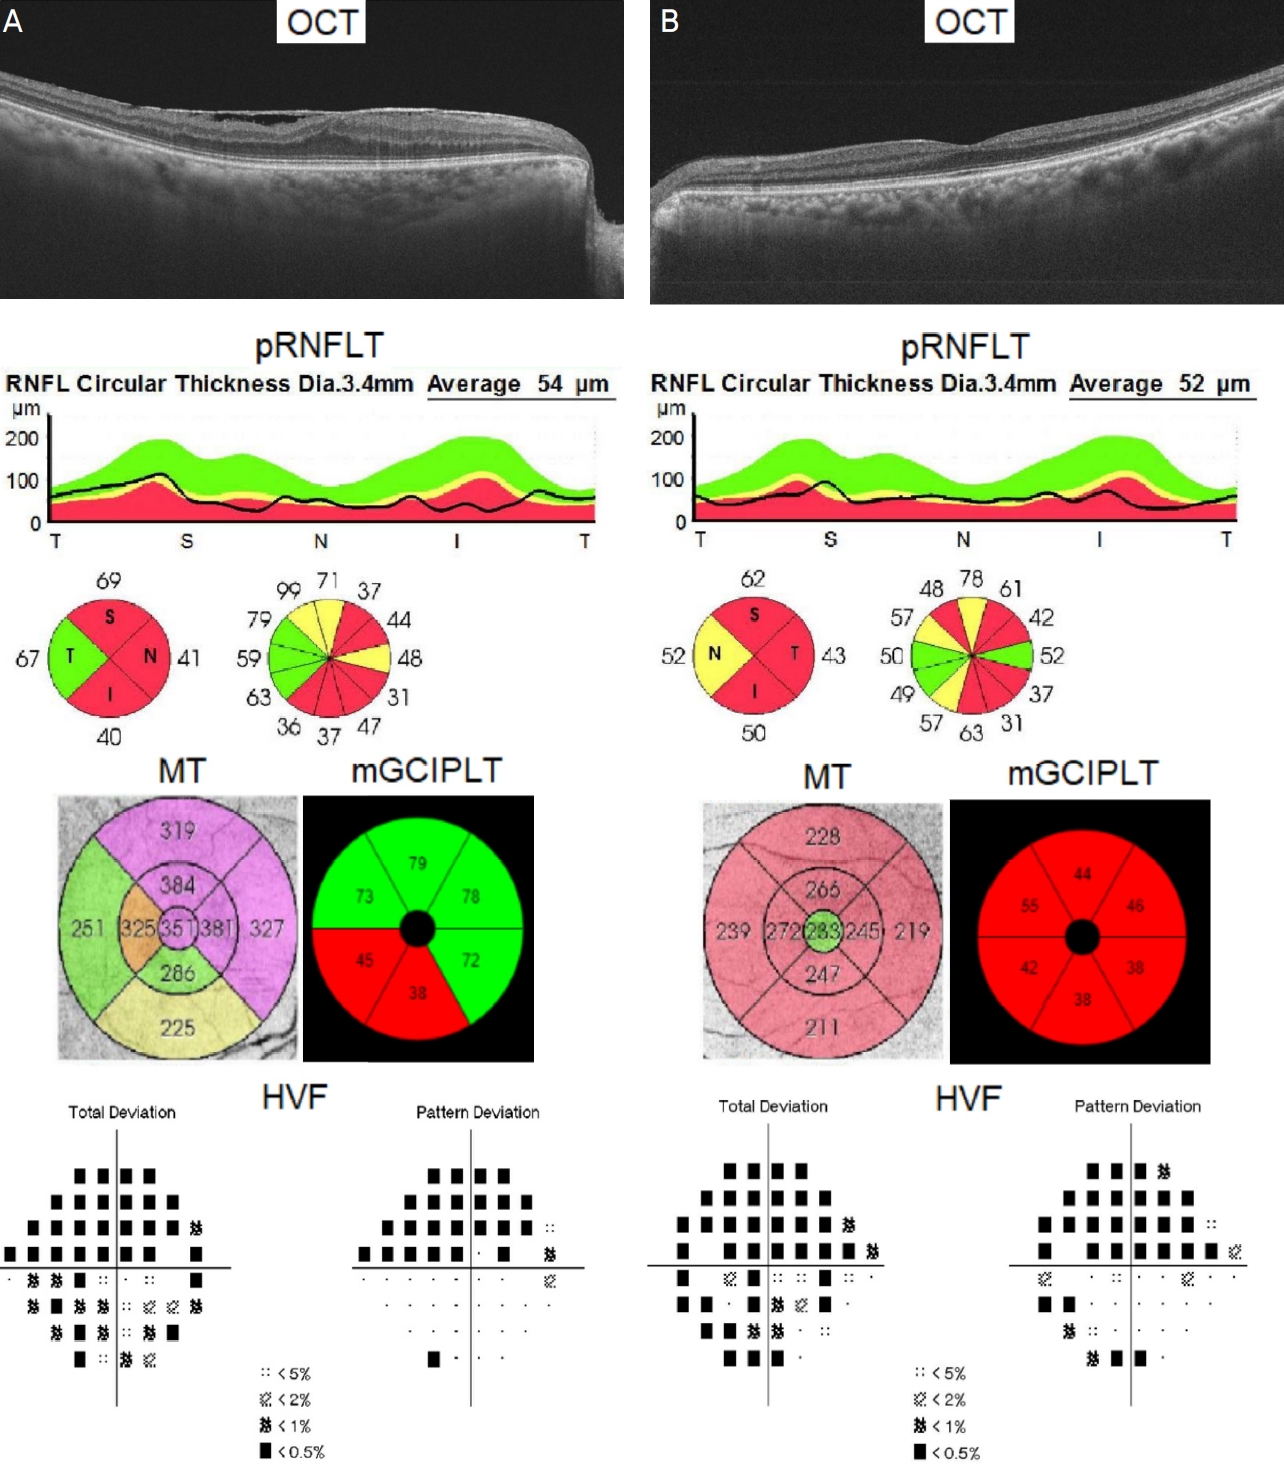
Representative cases of glaucoma patients with ERM and without ERM. (A) OCT image, pRNFLT, MT, mGCIPLT and HVF of a 66-year-old female patient in the right eye with ERM (B) OCT image, pRNFLT, MT, mGCIPLT and HVF of a 68-year-old female patient in the left eye without ERM. We can see temporal pRNFLT of glaucoma patient with ERM is thicker than that of glaucoma patient without ERM. These images also show thicker MT and mGCIPLT of glaucoma patient with ERM. Total deviation and pattern deviation plots of HVF between two patients seem to have similarities. OCT = optical coherence tomography; pRNFLT = peripapillary retinal nerve fiber layer thickness; MT = macular thickness; mGCIPLT = macular ganglion cell-inner plexiform layer thickness; HVF = Humphrey visual field; ERM = epiretinal membrane.
고 찰
OCT 장비를 이용하여 RNFL의 구조적 변화를 감지하는 것은 녹내장 진단과 진행 여부 확인을 위해 필수적인 작업으로 여겨지고 있다.6-8 특히, 황반부의 내경계막 표면에 형성되는 망막전막은 pRNFLT에 영향을 미칠 수 있어 이에 대한 많은 연구가 진행되어 왔다.
Lee et al11은 SD-OCT을 이용하여 녹내장이 없는 정상안에서 pRNFLT에 대한 망막전막의 영향을 분석하였다. 망막전막이 시신경 주변까지 침범한 경우에는 망막전막이 시신경 주변까지 침범하지 않은 경우보다 전체 및 이측 pRNFLT가 두껍게 측정되었고, 망막전막이 시신경 주변까지 침범하지 않은 경우에서도 정상 대조군보다 이측 pRNFLT가 두껍게 측정되었다. 본 연구에서는 망막전막이 시신경 주변까지 침범한 경우를 대상으로 하였고, 마찬가지로 전체 환자군에서 이측과 전체 pRNFLT가 두껍게 측정됨을 확인할 수 있었다. 그러나 Lee et al11의 연구에서는 시야검사가 실시되지 않아 비슷한 기능적 손상을 가진 경우 pRNFLT의 차이에 대해서는 파악할 수 없는 한계점이 있었다. Nakakura et al16은 SS-OCT를 이용하여 망막전막을 가진 녹내장 환자군에서 망막전막이 없는 녹내장 환자군보다 황반부의 RNFL과 GCIPL 두께가 두꺼웠음을 보고한 바 있는데, 본 연구에서도 망막전막이 있을 경우 mGCIPLT가 두껍게 측정되어 유사한 결과가 나왔다.
망막전막이 있는 경우 이측을 제외한 일부 pRNFLT의 영역에서 두께가 얇게 측정되며 녹내장을 악화시키는 요인으로 작용할 수 있다는 논문도 발표된 바 있다. Pastore et al13은 SD-OCT를 이용하여 녹내장이 없는 군을 대상으로 망막전막의 영향을 분석하였는데, 망막전막이 존재할 경우 전체 및 이측 pRNFLT가 두꺼웠으나, 하비측에서는 pRNFLT가 얇게 측정되는 결과를 보고하였다. Sakimoto et al17은 SS-OCT를 이용하여 단안에만 망막전막이 있는 녹내장 환자의 망막전막이 있는 눈과 없는 반대편 눈을 비교하였는데, 망막전막이 있을 경우 상측과 하측의 pRNFLT가 얇았으며, MD 값이 더 낮고, 더 많은 녹내장 점안제를 사용함을 밝혀 망막전막이 녹내장 악화를 일으키는 위험 요인이 될 수 있다고 설명하였다. 본 연구에서도 통계적으로 유의하지는 않았으나 초기 녹내장군에서 사분면으로 측정한 상측과 비측, 말기 녹내장에서 상측의 경우 망막전막이 있는 군이 망막전막이 없는 군보다 감소한 것을 확인할 수 있었다. 이에 대한 원인으로 망막전막에 의한 기계적인 힘(mechanical stress)이 안압을 견디는 신경절세포의 저항력을 떨어뜨려 생기게 되는 현상임이 제시된 바 있다.16 또는 망막전막으로 인해 생기는 구심성 힘으로 인해 시신경 주변 상하측의 망막신경섬유층이 중심 쪽으로 당겨지게 되는데, 이러한 힘이 구획화에 영향을 미쳐 이측화(temporalization)되는 경향이 생겨 pRNFLT의 일부 영역이 얇게 측정되었을 가능성이 있는 것으로 보이나, 이에 대한 추가적인 연구가 필요할 것으로 생각된다.
본 연구는 망막전막을 동반한 녹내장 환자군과 망막전막이 없는 대조군의 pRNFLT, mGCIPLT, MT를 SS-OCT를 사용하여 녹내장의 중등도에 따라 분석한 최초의 연구이다. 우리는 비슷한 정도의 녹내장 환자를 대상으로 비교하는 것이 필요하다고 판단하여 환자군과 대조군을 MD를 기준으로 일대일 match를 시행하여 분석하였다. 또한 연령, 성별, 백내장수술 여부, 안축장 길이도 매칭의 기준으로 삼았다. 그 결과, 이전 연구들과 비슷하게 전체 연구 대상자를 분석하였을 때, 망막전막이 있는 경우 전체 및 이측에서 pRNFLT가 두껍게 측정되는 것을 알 수 있었다.
녹내장의 중등도에 따라 측정한 결과에서는 망막전막이 있는 경우, 세 군 모두 사분면에서 이측 부분의 pRNFLT가 두껍게 나왔다. 그러나 말기 녹내장군에서는 평균 pRNFLT의 경우 망막전막이 있는 군과 없는 군 사이에 통계적으로 유의한 차이가 없는 것으로 나왔으며, 가장 적은 부위의 영역에서 두 군 사이에 유의한 차이가 발견되었다. 이는 녹내장 진행 정도가 심할수록 pRNFLT가 얇아져 녹내장 진행 정도의 영향을 덜 받는 바닥효과(floor effect)18,19와 관련된 것으로 보인다. 말기 녹내장의 경우, pRNFLT가 충분히 얇은 상태이므로 망막전막의 영향도 평균적으로 다소 줄어드는 것일 수 있다고 생각된다. mGCIPLT를 비롯한 망막내층의 경우 망막전막의 영향이 뚜렷한 것으로 알려져 있는데,20-22 본 연구에서도 망막전막이 있는 녹내장군에서 모든 영역에서 mGCIPLT가 유의하게 두껍게 측정됨을 확인할 수 있었다. 이러한 경향은 말기 녹내장군에서도 마찬가지였다. 망막전막의 경우 일반적으로 황반부에서 먼저 발생한 후 시신경 주변 등으로 원심성 진행을 하는 것이 일반적이다. mGCIPLT는 망막전막의 영향이 가장 뚜렷한 황반부에 위치하고 있어 말기 녹내장군에서도 pRNFLT와는 다르게 바닥효과가 나타나지 않는 것으로 생각된다. 12시간 영역으로 측정한 pRNFLT 값을 분석한 결과에서는 중기 녹내장 환자군이 7시, 11시 영역에서 초기 녹내장 환자군보다 망막전막의 영향이 두드러진 것으로 나타났다. 이에 망막전막이 존재할 경우 초기에서 중기로 진행하는 시기에서 pRNFLT 확인 시 주의가 필요할 것으로 보인다.
선행된 연구에 따르면 망막전막이 pRNFLT를 증가시키는 요인을 세 가지로 제시하였다.11,12,17 첫째, OCT 기기의 분할 오차(segmentation error)이다.11,12 망막전막이 생성하는 고반사 선이 RNFL의 경계선으로 오인될 가능성이 있다. 둘째, 망막전막이 발생시키는 견인력이다.11,12,17 망막전막의 정도가 심해짐에 따라 접선으로 작용하는 힘이 수직 방향으로 변하면서 망막층 두께의 증가가 일어날 수 있다는 것이다.11,12 이러한 영향은 외층 망막(outer retina)보다는 RNFL이 포함된 내층 망막(inner retina)에서 더 심한 것으로 알려져 있다.21-23 마지막 원인으로는 망막전막에 인한 혈관성 손상으로 인하여 RNFL의 혈관성 부종이 초래되었을 가능성이 제시된 바 있다.11,12,17 이번 연구에서 전체 환자군의 경우 망막전막이 있을 때 이측의 pRNFLT가 27.76%가 증가하는 것을 고려한다면, 혈관성 부종 및 시신경 주변 혈액 공급의 감소 같은 미세혈관(microvascular)적인 문제라기보다는 견인력과 분할 오차가 망막전막이 pRNFLT를 증가시키는 주요 원인으로 보인다. 또한 Sato et al24의 연구에서 망막전막이 있는 환자들에게 유리체절제술을 시행하여 견인력과 분할 오차를 일으킬 요소를 제거한 후 이측 pRNFLT가 수술 후 1달째 감소되기 시작하여 1년까지도 지속되는 것을 감안한다면, 이 두 가지 원인이 pRNFLT에 가장 큰 영향을 미치는 것으로 보여진다.
본 연구는 제한점은 첫째, 망막전막으로 인해 MD 값이 감소할 경우 실제 녹내장 손상 정도를 과대평가할 경우가 생길 수 있다는 것이다. 이 경우 전체 혹은 일부의 영역에서 망막전막이 있는 군의 pRNFLT가 망막전막이 없는 군에 비해 두껍게 측정될 수 있다. 현재 망막전막이 시야검사에 미치는 영향을 정량적으로 정확히 평가할 방법은 아직 없지만, Kim et al12이 시행한 종단 연구에서 망막전막을 진단받은 녹내장 환자들이 평균 28.1개월 동안 이측 pRNFLT가 60.3 ± 16.8 μm에서 74.8 ± 31.0 μm로 24.04% 증가할 때 MD는 -14.6 ± 9.2 dB에서 -15.4 ± 8.6 dB로 -1.1 dB 감소하는 것을 밝혀냈다. 이러한 결과를 통해 망막전막이 MD를 감소시키는 영향을 미칠 수 있음을 알 수 있다. 이러한 점은 본 연구의 제한점으로 생각되나, 이번 연구에서는 두 군 사이에 MD 값을 일대일 매칭하였을 뿐 아니라 이에 더불어 두 군 사이에 PSD, VFI에서도 유의한 차이가 없었기에 두 군은 유사한 녹내장 중등도를 가지고 있을 것으로 생각된다. 둘째, 녹내장 환자를 녹내장 정도에 따라 분류해서 시행한 분석의 경우 각 군의 대상 환자 수가 다소 적은 편이라는 것이다. 셋째, 단면 연구로 시행되었기 때문에 시간에 따른 망막전막의 영향을 파악하기는 어려웠다.
결론적으로 본 연구를 통해 망막전막이 있는 경우 전체 환자군에서 pRNFLT 평균 및 이측, 7시, 11시 영역, mGCIPLT 및 ETDRS subfield로 구분한 MT의 모든 영역에서 두께가 두껍게 측정됨을 확인할 수 있었으며, 녹내장이 심한 정도에 따라 pRNFLT가 두껍게 나타나는 양상에는 차이가 있음을 알 수 있었다. 망막전막을 동반한 녹내장 환자들은 pRNFLT로 녹내장의 정도나 진행 정도를 파악할 경우 망막전막의 영향을 생각해야 하며, 특히 녹내장의 중등도에 따라 망막전막이 미치는 영향의 정도가 다름을 고려해야 한다.
Acknowledgements
This work was presented in The 128th Annual Meeting of the Korean Ophthalmological Society.
Notes
Conflicts of Interest
The authors have no conflicts to disclose.
References
Biography
한희용 / Heeyong Han
한국보훈복지의료공단 중앙보훈병원 안과
Department of Ophthalmology,Veterans Health Service (VHS) Medical Center
