


ļģ╣ļé┤ņןņØ┤ļ×Ć ĒŖ╣ņ¦ĢņĀüņØĖ ņŗ£ņŗĀĻ▓ĮņåÉņāüĻ│╝ ņŗ£ņĢ╝Ļ▓░ņåÉņØ┤ ņ¦äĒ¢ēĒĢśļŖö ņ¦łĒÖśņØ┤ļŗż. ļģ╣ļé┤ņןņä▒ ņŗ£ņĢ╝Ļ▓░ņåÉņØś ņ¦äĒ¢ēņØä ļ░£Ļ▓¼ĒĢśļŖö Ļ▓āņØĆ ļģ╣ļé┤ņן ĒÖśņ×ÉņØś ņ╣śļŻīļź╝ Ļ▓░ņĀĢĒĢśļŖö ļŹ░ ņ׳ņ¢┤ņä£ ļ¦żņÜ░ ņżæņÜöĒĢśļ®░, Ēśäņ×¼ Ēæ£ņżĆ ņ×ÉļÅÖņŗ£ņĢ╝Ļ▓Ćņé¼(standard automated perimetry)ļź╝ ņØ┤ņÜ®ĒĢ£ ņŗ£ņĢ╝ ĒÅēĻ░ĆĻ░Ć ļģ╣ļé┤ņןņä▒ ņŗ£ņĢ╝Ļ▓░ņåÉņØś ņ¦äĒ¢ēņØä ĒÖĢņØĖĒĢśļŖö Ēæ£ņżĆ Ļ▓Ćņé¼ ļ░®ļ▓Ģņ£╝ļĪ£ ņé¼ņÜ®ļÉśĻ│Ā ņ׳ļŗż[1]. ļģ╣ļé┤ņןņä▒ ņŗ£ņĢ╝Ļ▓░ņåÉņØś ņ¦äĒ¢ēņØä ĒīÉļ│äĒĢśļŖö ĻĖ░ņżĆņ£╝ļĪ£ ļŗżņ¢æĒĢ£ ļ░®ļ▓ĢņØ┤ ņĀ£ņŗ£ļÉśņ¢┤ ņÖöļŖöļŹ░, Advanced Glaucoma Intervention Study (AGIS), Collaborative Initial Glaucoma Treatment Study (CIGTS), Early Manifest Glaucoma Trial (EMGT), Ocular Hypertension Treatment Study (OHTS)ņÖĆ Ļ░ÖņØĆ ļīĆĻĘ£ļ¬© ļ¼┤ņ×æņ£ä ņ×äņāüņŗ£ĒŚśļōżņØ┤ ņŗ£ņĢ╝Ļ▓Ćņé¼ņØś ļ│ĆņłśļōżņØä ņØ┤ņÜ®ĒĢśņŚ¼ ņĀ£ņŗ£ĒĢ£ rule-based criteriaņŚÉņä£ļČĆĒä░ Humphrey visual field analyzerņŚÉņä£ ņĀ£Ļ│ĄĒĢśļŖö Glaucoma progression analysisņÖĆ Ļ░ÖņØĆ event-based analysisĻ░Ć ņ¦äĒ¢ē ĒīÉļ│äņŚÉ ņØ┤ņÜ®ļÉśĻ│Ā ņ׳ļŗż[2-6]. ĒĢśņ¦Ćļ¦ī ņØ┤ļ¤¼ĒĢ£ ļ░®ļ▓ĢļōżņØĆ ņŗ£ņĢ╝Ļ▓░ņåÉņØś ļ│ĆĒÖöņ£©(rate of change)ņŚÉ ļīĆĒĢ£ ņĀĢļ│┤ļź╝ ņĀ£Ļ│ĄĒĢśņ¦Ć ļ¬╗ĒĢśļ®░, ļ╣ĀļźĖ ņŗ£ņĢ╝Ļ▓░ņåÉņØä ļ│┤ņØ┤ļŖö ĒÖśņ×ÉņŚÉĻ▓īļŖö ņĪ░ĻĖ░ņŚÉ ņĀüĻĘ╣ņĀü ņ╣śļŻīļź╝ ņŗ£Ē¢ēĒĢśļŖö Ļ▓āņØ┤ ņżæņÜöĒĢśļ»ĆļĪ£ ņŗ£ņĢ╝Ļ▓░ņåÉņØś ļ│ĆĒÖöņ£© ĒÖĢņØĖņØä ņ£äĒĢ£ trend-based analysisĻ░Ć ņŚ░ĻĄ¼ ļ░Å Ļ░£ļ░£ļÉśņŚłļŗż.[7]. Visual field index (VFI) ņÖĆ mean deviation (MD)Ļ│╝ Ļ░ÖņØ┤ global indexļź╝ ņØ┤ņÜ®ĒĢ£ global trend-based analysisĻ░Ć ņ׳ļŖö ļ░śļ®┤, ņŗ£ņĢ╝Ļ▓Ćņé¼ņØś Ļ░ü ņ¦ĆņĀÉņŚÉ ļīĆĒĢśņŚ¼ ņŗ£ņĢ╝Ļ▓░ņåÉņØś ļ│ĆĒÖöņ£©ņØä Ļ│äņé░ĒĢśļŖö pointwise trend-based analysisļÅä ņ׳ļŗż[8-10].
Pointwise trend-based analysisņØś Ļ▓ĮņÜ░, ņŗ£ņĢ╝Ļ▓Ćņé¼ņØś Ļ░ü ņ¦ĆņĀÉņŚÉņä£ ņŗ£Ļ░äņŚÉ ļö░ļźĖ ņŗ£ņĢ╝Ļ▓░ņåÉņØś ļ│ĆĒÖöļź╝ ļŗżņ¢æĒĢ£ ĒÜīĻĘĆ ļ¬©ļŹĖņØä ĒåĄĒĢ┤ ļČäņäØĒĢśņśĆļŖöļŹ░, ļīĆĒæ£ņĀüņ£╝ļĪ£ ņäĀĒśĢ(linear) ļ¬©ļŹĖņØ┤ Ļ░Ćņן ļ¦ÄņØ┤ ņŚ░ĻĄ¼ļÉśņŚłļŗż[11,12]. ņØ┤ ņÖĖņŚÉļÅä ņ¦ĆņłśĒśĢ(exponential), ļĪ£ĻĘĖĒśĢ(logistic), ļŗżĒĢŁĒśĢ(polynomial)Ļ│╝ Ļ░ÖņØĆ ļŗżņ¢æĒĢ£ ĒÜīĻĘĆ ļ░®ļ▓ĢņØä ĒåĄĒĢśņŚ¼ ļ¬©ļŹĖņØś ņĀüĒĢ® ņĀĢļÅäļ┐Éļ¦īņØ┤ ņĢäļŗłļØ╝ ņśłņĖĪ ņä▒ļŖźļÅä ļ╣äĻĄÉļÉśņŚłļŗż[12-16]. ĒŖ╣Ē׳, Chen et al [14]Ļ│╝ Caprioli et al [13]ņØĆ ņŗ£ņĢ╝Ļ▓Ćņé¼ņØś Ļ░ü ņ¦ĆņĀÉņŚÉ ļö░ļØ╝ ņŗ£ņĢ╝Ļ▓░ņåÉņØś ļ│ĆĒÖöņ£©ņØ┤ ļŗżļź╝ Ļ▓āņØ┤ļØ╝ļŖö Ļ░ĆņĀĢ ĒĢśņŚÉ ļŗżņ¢æĒĢ£ ĒÜīĻĘĆ ļ¬©ļŹĖņØä ļ│æĒĢ®ĒĢśņŚ¼ pointwise trendbased analysisļź╝ ņŗ£ļÅäĒĢśņśĆļŗż.
ņĢäņŗ£ņĢä ņØĖņóģņØĆ ļŗżļźĖ ņØĖņóģņŚÉ ļ╣äĒĢ┤ ĻĘ╝ņŗ£ ļō▒ņØś ņ£äĒŚśņØĖņ×É ļČäĒżĻ░Ć ļåÆĻ│Ā ņĀĢņāüņĢłņĢĢļģ╣ļé┤ņן ļō▒ņØś ņ£Āļ│æļźĀņØ┤ ņ£ĀņØśĒĢśĻ▓ī ļåÆļŗż[17,18]. ĒĢśņ¦Ćļ¦ī Ēśäņ×¼Ļ╣īņ¦Ć ņĢäņŗ£ņĢäņØĖņØä ļīĆņāüņ£╝ļĪ£ ļģ╣ļé┤ņןņä▒ ņŗ£ņĢ╝Ļ▓░ņåÉ ļ│ĆĒÖöņŚÉ ļīĆĒĢ┤ ņŗ£ņĢ╝Ļ▓Ćņé¼ņØś Ļ░ü ņ¦ĆņĀÉņŚÉņä£ ņŗ£Ļ░äņŚÉ ļö░ļźĖ ĒÜīĻĘĆļČäņäØņØä ņŗ£Ē¢ēĒĢ£ ņŚ░ĻĄ¼Ļ░Ć ļČĆņĪ▒ĒĢśļŗż. ņØ┤ņŚÉ ļ│Ė ņŚ░ĻĄ¼ņŚÉņä£ļŖö ĒĢ£ĻĄŁņØĖ ļģ╣ļé┤ņן ĒÖśņ×ÉņŚÉ ņ׳ņ¢┤ņä£ Ēæ£ņżĆņ×ÉļÅÖņŗ£ņĢ╝Ļ▓Ćņé¼ļ▓ĢņØś Ļ░ü Ļ▓Ćņé¼ ņ¦ĆņĀÉņŚÉņä£ņØś ņŗ£Ļ░äņŚÉ ļö░ļźĖ ļģ╣ļé┤ņןņä▒ ņŗ£ņĢ╝Ļ▓░ņåÉ ļ│ĆĒÖöļź╝ ņäĀĒśĢ(linear), ņ¦ĆņłśĒśĢ(exponential), ļŗżĒĢŁĒśĢ(polynomial)ņØś ĒÜīĻĘĆļČäņäØņØä ĒåĄĒĢśņŚ¼ ļ¬©ļŹĖņŚÉ ņĀüĒĢ®ņŗ£ĒéżĻ│Ā ņØ┤Ēøä ļ│ĆĒÖöļź╝ ņśłņĖĪĒĢ┤ļ│┤Ļ│Āņ×É ĒĢ£ļŗż.
ļīĆņāüĻ│╝ ļ░®ļ▓Ģ
ļīĆņāü
6ļģä ņØ┤ņāü Ļ▓ĮĻ│╝ Ļ┤Ćņ░░ĒĢśņśĆņ£╝ļ®░ ņŗ£Ē¢ēĒĢ£ ņŗ£ņĢ╝Ļ▓Ćņé¼ņØś ĒܤņłśĻ░Ć 10ĒÜī ņØ┤ņāüņØĖ ļģ╣ļé┤ņן ĒÖśņ×ÉļōżņØä ļīĆņāüņ£╝ļĪ£ ņŚ░ĻĄ¼ļź╝ ņŗ£Ē¢ēĒĢśņśĆļŗż. ņŗĀļó░ļÅä ņ¦ĆĒæ£ņŚÉņä£ ņŻ╝ņŗ£ ņāüņŗżņØ┤ 30% ņØ┤ĒĢś, Ļ░ĆņØīņä▒ ļ░śņØæņØ┤ 30% ņØ┤ĒĢś, Ļ░Ćņ¢æņä▒ ļ░śņØæņØ┤ 15% ņØ┤ĒĢśņØĖ ņŗ£ņĢ╝Ļ▓Ćņé¼ļ¦ī ļČäņäØņŚÉ ĒżĒĢ©ļÉśņŚłļŗż. ņŗ£ņĢ╝Ļ▓Ćņé¼ņØś ĒĢÖņŖĄ ĒÜ©Ļ│╝ļź╝ ļ░░ņĀ£ĒĢśĻĖ░ ņ£äĒĢ┤ ņ┤łĻĖ░ 2ĒÜīņØś ņŗ£ņĢ╝Ļ▓Ćņé¼ļŖö ļČäņäØņŚÉņä£ ņĀ£ņÖĖĒĢśņśĆļŗż[19,20]. ļ¦īņĢĮ ņŗ£ņĢ╝Ļ▓Ćņé¼ņØś ĒĢ£ ņ¦ĆņĀÉņŚÉņä£ņØś ņ┤łĻĖ░ 3ĒÜīņØś ņŚŁņ╣śĻ░ÆņØ┤ ļ¬©ļæÉ 0 decibel (dB)ņØĖ Ļ▓ĮņÜ░ ĻĘĖ ņ¦ĆņĀÉņØĆ ļČäņäØņŚÉņä£ ņĀ£ņÖĖļÉśņŚłļŗż. ļ¬©ļōĀ ņŗ£ņĢ╝Ļ▓Ćņé¼ļŖö Humphrey Field Analyzer (Carl Zeiss Meditec Inc, Dublin, CA, USA)ņØś 24-2 SITA standard ņĖĪņĀĢļ▓Ģņ£╝ļĪ£ ņŗ£Ē¢ēļÉśņŚłĻ│Ā, size III white ņŗ£Ēæ£Ļ░Ć ņé¼ņÜ®ļÉśņŚłļŗż. ļČäņäØņŚÉļŖö ņŗ£ņĢ╝Ļ▓Ćņé¼ņØś Ļ░ü Ļ▓Ćņé¼ ņ¦ĆņĀÉ(test location)ņŚÉņä£ņØś ņŚŁņ╣śĻ░Æ(threshold value, THV)ņØ┤ dB ļŗ©ņ£äļĪ£ ņØ┤ņÜ®ļÉśņŚłļŗż. ļ│Ė ņŚ░ĻĄ¼ļŖö ņāØļ¬ģņ£żļ”¼ņŗ¼ņØśņ£äņøÉĒÜī(Institutional Review Board)ļĪ£ļČĆĒä░ ņŖ╣ņØĖņØä ļ░øņĢśņ£╝ļ®░(ņŖ╣ņØĖ ļ▓łĒśĖ: 2203-025-113) Ļ▓Ćņé¼ņÖĆ ļČäņäØ Ļ│╝ņĀĢņØĆ Declaration of HelsinkiņŚÉ ņØśĻ▒░ĒĢśņŚ¼ ņŗżĒ¢ēļÉśņŚłļŗż.
ĒÜīĻĘĆ ļ¬©ļŹĖ
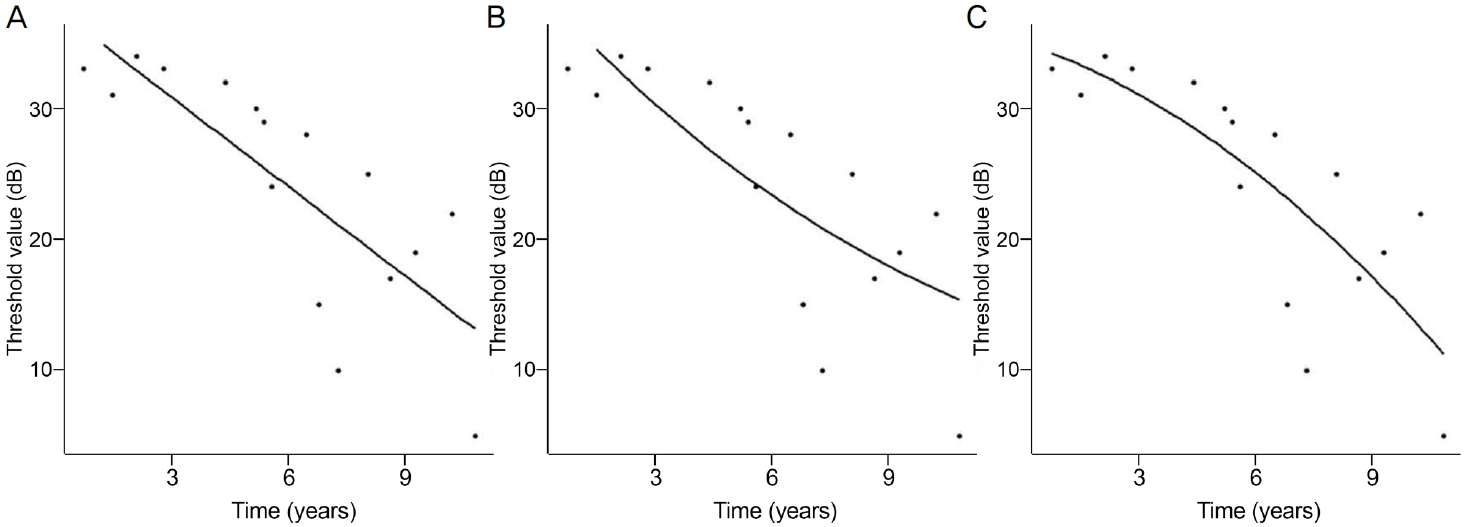
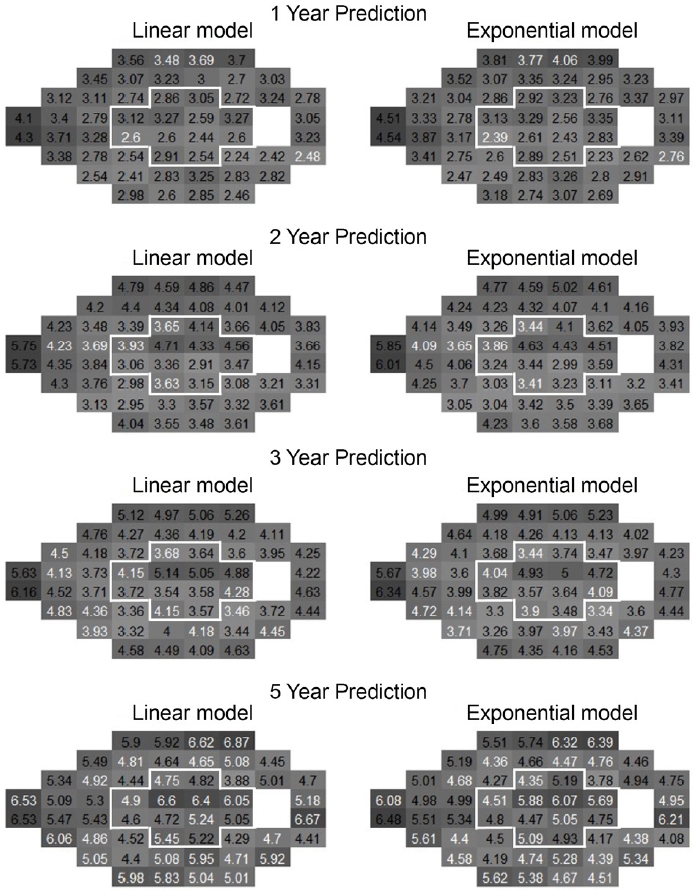
ņŗ£ņĢ╝Ļ▓Ćņé¼ņØś ļæÉ ĻĄ░ļŹ░ņØś ļ¦╣ņĀÉņØä ņĀ£ņÖĖĒĢ£ Ļ░ü ņ¦ĆņĀÉņŚÉņä£ņØś ņŗ£Ļ░äņŚÉ ļö░ļźĖ ņŚŁņ╣śĻ░Æ(dB)ņØś ļ│ĆĒÖöļź╝ ņäĀĒśĢ(linear), ņ¦ĆņłśĒśĢ(exponential), ļŗżĒĢŁĒśĢ(polynomial)ņØś ņäĖ Ļ░Ćņ¦Ć ļ░®ņŗØņ£╝ļĪ£ ĒÜīĻĘĆļČäņäØņØä ņŗ£Ē¢ēĒĢśņśĆļŗż. Ļ░ü ļ¬©ļŹĖļōżņØś ņłśĒĢÖņĀü ĒÜīĻĘĆņŗØņØĆ ļŗżņØīĻ│╝ Ļ░Öļŗż(Fig. 1).
ņäĀĒśĢ(linear): y = ╬▒ + ╬▓x where x: time (1)
ņ¦ĆņłśĒśĢ(exponential): Iny = ╬▒ + ╬▓x where x: time (2)
ļŗżĒĢŁĒśĢ(polynomial): y = ╬▒ + ╬▓1x + ╬▓2x2 where x: time (3)
ņóģņåŹļ│ĆņłśļŖö ņŚŁņ╣śĻ░Æ(y) (dB), ļÅģļ”Įļ│ĆņłśļŖö ņŗ£Ļ░ä(x) (ļģä), ╬▒, ╬▓, ╬▓1, ╬▓2ļŖö ĒÜīĻĘĆļČäņäØņØä ĒåĄĒĢ┤ ņé░ņČ£ļÉśļŖö Ļ│äņłśņØ┤ļŗż. ĒÜīĻĘĆ ļ¬©ļŹĖņØĆ ņĄ£ņåīņĀ£Ļ│▒ļ▓ĢņØä ņØ┤ņÜ®ĒĢśņŚ¼ ņé░ņČ£ļÉśņŚłļŗż.
ļ¬©ļŹĖ ņĀüĒĢ®
ņŗ£ņĢ╝Ļ▓Ćņé¼ņØś Ļ░ü ņ¦ĆņĀÉņŚÉņä£ ņĀä ĻĖ░Ļ░äņØś ņŚŁņ╣śĻ░ÆņØ┤ Ļ░ü ļ¬©ļŹĖņØś ņĀüĒĢ®ļÅä ĒÅēĻ░Ć(goodness of fit)ļź╝ ņ£äĒĢ┤ ņé¼ņÜ®ļÉśņŚłļŗż. ņśżņ░©ļŖö ļ¬©ļŹĖņØś ņČöņĀĢĻ░Æ(Z ^
ĒÅēĻĘĀ ņĀ£Ļ│▒ĻĘ╝ ņśżņ░©(root mean squared error, RMSE):
where z: actual THV, z ^
ļ¬©ļŹĖ ņśłņĖĪ
ļ¬©ļŹĖņØä ĒåĄĒĢ£ ņŚŁņ╣śĻ░Æ ņśłņĖĪņØä ņ£äĒĢ┤ ņ┤łĻĖ░ 5ļģäĻ░äņØś ņŗ£ņĢ╝Ļ▓Ćņé¼Ļ░Ć ļ¬©ļŹĖ Ļ│äņłśļź╝ ņČöņĀĢĒĢśļŖöļŹ░ ņé¼ņÜ®ļÉśņŚłļŗż. ņČöņĀĢļÉ£ ļ¬©ļŹĖņØä ņØ┤ņÜ®ĒĢśņŚ¼ ņØ┤Ēøä 1ļģä, 2ļģä, 3ļģä, 5ļģä ĒøäņØś ņŚŁņ╣śĻ░ÆņØä ņśłņĖĪĒĢśņśĆļŗż. ņČöņĀĢļÉ£ ņŚŁņ╣śĻ░ÆņØ┤ ņØīņłśņØĖ Ļ▓ĮņÜ░ 0 dBļĪ£ ņĪ░ņĀĢĒĢśņśĆņ£╝ļ®░, ņśłņĖĪ ņŚŁņ╣śĻ░ÆņØ┤ ņāüņŖ╣ļÉśļŖö Ļ▓ĮņÜ░ņŚÉļŖö ņØ┤ņĀä 4Ļ░£ņØś Ļ▓Ćņé¼ Ļ░ÆņØś ĒÅēĻĘĀĻ░Æņ£╝ļĪ£ ļīĆņ▓┤ĒĢśņśĆļŗż. 1ļģä, 2ļģä, 3ļģä, 5ļģä ĒøäņØś ņŚŁņ╣śĻ░ÆņØ┤ Ļ▓░ņĖĪņØĖ Ļ▓ĮņÜ░, ņäĀĒśĢļ│┤Ļ░äļ▓Ģ(linear interpolation)ņØä ņØ┤ņÜ®ĒĢśņśĆļŗż[14]. ņśłņĖĪ ņśżņ░©ļŖö ļ¬©ļŹĖņØś ņśłņĖĪĻ░ÆĻ│╝ ņŗżņĀ£ ņŚŁņ╣śĻ░ÆņØś ņ░©ņØ┤ļĪ£ ņĀĢņØśĒĢ£ Ēøä, RMSEļź╝ ņØ┤ņÜ®ĒĢśņŚ¼ ņŗ£ņĢ╝Ļ▓Ćņé¼ņØś Ļ░ü ņ¦ĆņĀÉņŚÉņä£ņØś Ļ░ü ņŗ£ņĀÉ(1ļģä, 2ļģä, 3ļģä, 5ļģä Ēøä)ņŚÉņä£ ņäĖ ļ¬©ļŹĖņØś ņśłņĖĪ ņä▒ļŖźņØä ļ╣äĻĄÉĒĢśņśĆļŗż. ļŹöļČłņ¢┤ ņŗ£ņĢ╝Ļ▓Ćņé¼ Ļ░ü ņ¦ĆņĀÉļōżņØä ņ┤łĻĖ░ ņŚŁņ╣śĻ░ÆņŚÉ ļö░ļØ╝ ļ¼Čņ¢┤ Ļ░ü ņ┤łĻĖ░ ņŚŁņ╣śĻ░Æ ĻĄ¼Ļ░äņŚÉņä£ ņäĖ ļ¬©ļŹĖņØś ņśłņĖĪ ņä▒ļŖźņØä ļ╣äĻĄÉĒĢśņśĆļŗż. ņØ┤Ēøä ņŗ£ņĢ╝Ļ▓Ćņé¼ 52Ļ░£ Ļ▓Ćņé¼ ņ¦ĆņĀÉņØä ņżæņŗ¼ļČĆ 12ņ¦ĆņĀÉ ļ░Å ņŻ╝ļ│ĆļČĆ 40ņ¦ĆņĀÉņ£╝ļĪ£ ļéśļłäņ¢┤ Ļ░ü ļČĆņ£äņŚÉņä£ ņäĖ ļ¬©ļŹĖņØś ņśłņĖĪ ņä▒ļŖźņØä ļ╣äĻĄÉĒĢśņśĆļŗż.
ĒåĄĻ│ä ļČäņäØ
ņäĀĒśĢ, ņ¦ĆņłśĒśĢ, ļŗżĒĢŁĒśĢ ĒÜīĻĘĆņØś RMSEļŖö ņØ╝ņøÉļČäņé░ļČäņäØ(one-way ANOVA)ņØä ņØ┤ņÜ®ĒĢśņŚ¼ ļ╣äĻĄÉĒĢśņśĆļŗż. ņØ┤Ēøä ņé¼Ēøä Ļ▓ĆņĀĢņØä ņ£äĒĢ┤ņä£ ļ│ĖĒÄśļĪ£ļŗł ĻĄÉņĀĢ(Bonferroni correction) ļ░®ļ▓ĢņØä ņØ┤ņÜ®ĒĢ£ ļīĆņØæ Ēæ£ļ│Ė TĻ▓ĆņĀĢņØä ņŗżņŗ£ĒĢśņśĆļŗż. ļśÉĒĢ£, ņŗ£ņĢ╝Ļ▓Ćņé¼ ņ¦ĆņĀÉņŚÉ ļö░ļźĖ ņäĀĒśĢ(Linear)Ļ│╝ ņ¦ĆņłśĒśĢ(Exponential) ĒÜīĻĘĆņØś RMSE ļ╣äĻĄÉņŚÉļŖö ļīĆņØæĒæ£ļ│Ė TĻ▓ĆņĀĢņØä ņé¼ņÜ®ĒĢśņśĆļŗż. ļ¬©ļŹĖ ņĀüĒĢ®, ņśłņĖĪ ļ░Å RMSE ļ╣äĻĄÉņŚÉ ļīĆĒĢ£ ĒåĄĻ│ä ļČäņäØņØĆ R (4.1.1 ļ▓äņĀä) ĒöäļĪ£ĻĘĖļשņØä ņØ┤ņÜ®ĒĢśņśĆļŗż.
Ļ▓░ Ļ│╝
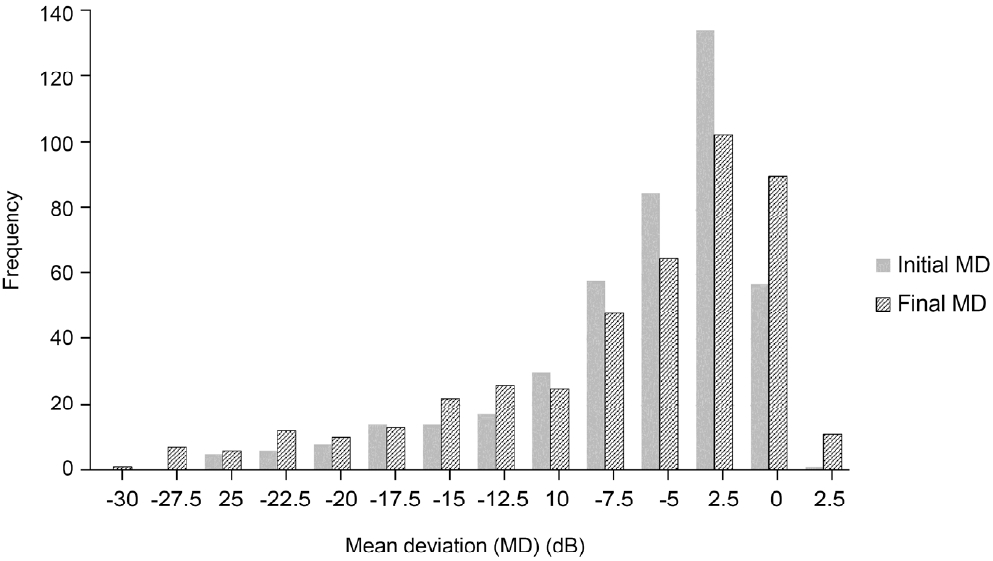
ņ┤Ø ĒÖśņ×É 280ļ¬ģņØś 439ņĢłņØ┤ ļ│Ė ņŚ░ĻĄ¼ņŚÉ ĒżĒĢ©ļÉśņŚłļŗż. ņĄ£ņ┤ł ņŗ£ņĢ╝Ļ▓Ćņé¼ ņŗ£ņØś ĒÅēĻĘĀ ļéśņØ┤ļŖö 60.66 ┬▒ 14.60ņäĖ, ĒÅēĻĘĀ Ļ▓ĮĻ│╝ Ļ┤Ćņ░░ ĻĖ░Ļ░äņØĆ 9.64 ┬▒ 2.14ļģäņØ┤ņŚłļŗż. ĒÖśņ×Éļŗ╣ ļČäņäØņŚÉ ņé¼ņÜ®ļÉ£ ĒÅēĻĘĀ ņŗ£ņĢ╝Ļ▓Ćņé¼ Ļ░£ņłśļŖö 13.02 ┬▒ 2.49ņśĆĻ│Ā, ļČäņäØņŚÉ ņé¼ņÜ®ļÉ£ ņŗ£ņĢ╝Ļ▓Ćņé¼ ņ¦ĆņĀÉņØś Ļ░£ņłśļŖö 21,981Ļ░£ņśĆļŗż. ņĄ£ņ┤ł ĻĘĖļ”¼Ļ│Ā ļ¦łņ¦Ćļ¦ē ņŗ£ņĢ╝Ļ▓Ćņé¼ņØś ĒÅēĻĘĀ MDļŖö Ļ░üĻ░ü -5.95 ┬▒ 5.48 dB, -6.56 ┬▒ 6.94 dBņØ┤ņŚłĻ│Ā, ĻĘĖ ļČäĒż ļ│ĆĒÖöļŖö Figure 2ņÖĆ Ļ░Öļŗż. ņĄ£ņ┤ł ņŗ£ņĢ╝Ļ▓Ćņé¼ņØś ĒÅēĻĘĀ pattern standard deviationņØĆ 5.45 ┬▒ 4.33 dB, ĒÅēĻĘĀ VFIļŖö 87.18 ┬▒ 16.87%ņśĆļŗż(Table 1).
ļ¬©ļŹĖ ņĀüĒĢ®
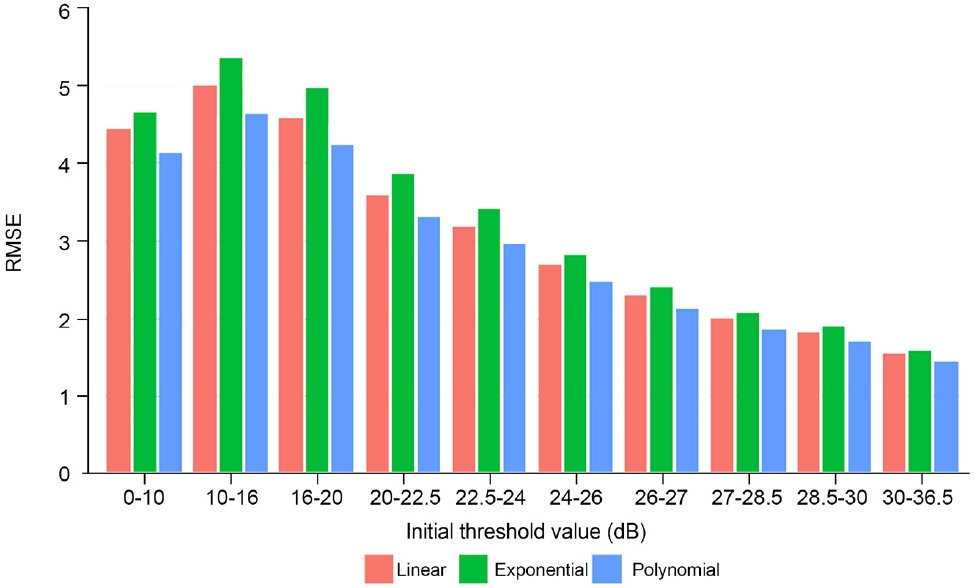
ņŗ£Ļ░äņŚÉ ļö░ļźĖ ņŗ£ņĢ╝Ļ▓Ćņé¼ ņĀäņ▓┤ļź╝ ņØ┤ņÜ®ĒĢśņŚ¼ ņäĀĒśĢ, ņ¦ĆņłśĒśĢ, ļŗżĒĢŁĒśĢ ļ¬©ļŹĖņØś ņäĖ Ļ░Ćņ¦Ć ļ░®ņŗØņ£╝ļĪ£ ļ¬©ļŹĖ ņĀüĒĢ®ņØä ņŗ£Ē¢ēĒĢśņśĆļŗż. ņäĖ ļ¬©ļŹĖņØä ļ╣äĻĄÉĒĢśņśĆņØä ļĢī, ļŗżĒĢŁĒśĢ ļ¬©ļŹĖņØ┤ Ļ░Ćņן ļé«ņØĆ RMSEļź╝ ļ│┤ņśĆļŗż(p<0.001, Table 2).
ņ┤łĻĖ░ ņŚŁņ╣śĻ░ÆņŚÉ ļö░ļØ╝ ņĖĄĒÖöĒĢśņśĆņØä ļĢī, ņ┤łĻĖ░ ņŚŁņ╣śĻ░ÆņØ┤ ņ”ØĻ░ĆĒĢĀņłśļĪØ RMSEĻ░Ć Ļ░ÉņåīĒĢśļŖö Ļ▓ĮĒ¢źņØä ļ│┤ņśĆļŗż(Pearson coefficient=-0.491,p<0.001). ņ┤łĻĖ░ ņŚŁņ╣śĻ░ÆņŚÉ ļö░ļØ╝ ņĖĄĒÖöĒĢśņŚ¼ ņäĖ ļ¬©ļŹĖņØś ņĀüĒĢ®ņØä ļ╣äĻĄÉĒĢśņśĆņØä ļĢī, ļŗżĒĢŁĒśĢ ļ¬©ļŹĖņØ┤ ļ¬©ļōĀ ņ┤łĻĖ░ ņŚŁņ╣śĻ░Æ ņĖĄĒÖö ĻĘĖļŻ╣ņŚÉņä£ Ļ░Ćņן ļé«ņØĆ RMSEļź╝ ļ│┤ņśĆļŗż(p<0.001, Fig. 3).
ļ¬©ļŹĖ ņśłņĖĪ
ņ┤łĻĖ░ 5ļģäĻ░äņØś ņŗ£ņĢ╝Ļ▓Ćņé¼ļź╝ ņØ┤ņÜ®ĒĢśņŚ¼ ļ¬©ļŹĖņØä ņČöņĀĢĒĢ£ ļÆż 1ļģä, 2ļģä, 3ļģä, 5ļģä ĒøäņØś ņŚŁņ╣śĻ░ÆņØä ņśłņĖĪĒĢśņśĆņØä ļĢī, ļŗżĒĢŁĒśĢ ļ¬©ļŹĖņØś RMSEĻ░Ć Ļ░Ćņן ļåÆņĢśļŗż(p<0.001).
ņ¦ĆņłśĒśĢĻ│╝ ņäĀĒśĢ ļ¬©ļŹĖņØä ļ╣äĻĄÉĒĢśņśĆņØä ļĢī, 1ļģä ĒøäņØś ņśłņĖĪ RMSEļŖö ņäĀĒśĢ ļ¬©ļŹĖņØ┤ ļŹö ļé«ņĢśĻ│Ā(p<0.001), 2ļģä ĒøäņØś ņśłņĖĪ RMSEļŖö ļæÉ ļ¬©ļŹĖ ņé¼ņØ┤ņŚÉ ņ░©ņØ┤Ļ░Ć ņŚåņŚłļŗż. 3ļģä, 5ļģä ĒøäņØś ņśłņĖĪ RMSEļŖö ņ¦ĆņłśĒśĢ ļ¬©ļŹĖņØ┤ ņäĀĒśĢ ļ¬©ļŹĖļ│┤ļŗż ļŹö ļé«ņĢśļŗż(ļ¬©ļōĀ p<0.001) (Table 3).
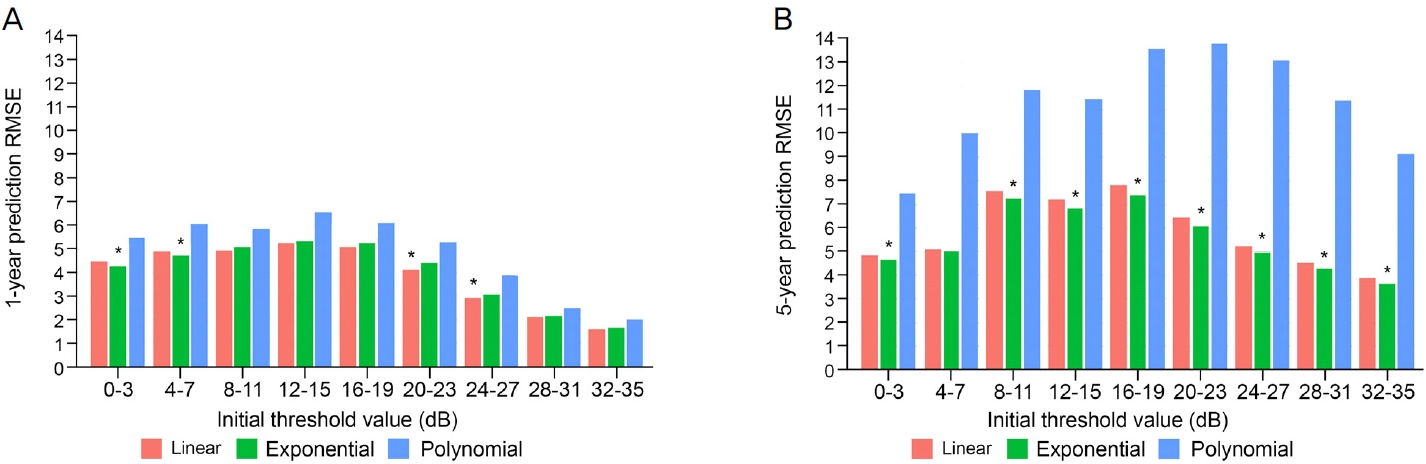
Ļ░ü ņśłņĖĪ ļģäļÅäļ¦łļŗż ņ┤łĻĖ░ ņŚŁņ╣śĻ░ÆņŚÉ ļö░ļØ╝ ņĖĄĒÖöĒĢśņŚ¼ ņäĖ ļ¬©ļŹĖņØś RMSEļź╝ ļ╣äĻĄÉĒĢśņśĆļŗż. 1, 2ļģä ņśłņĖĪņØś Ļ▓ĮņÜ░, ņ┤łĻĖ░ ņŚŁņ╣śĻ░Æ 0-7 dB ĻĄ¼Ļ░äņŚÉņä£ļŖö ņ¦ĆņłśĒśĢ ļ¬©ļŹĖņØ┤, 20-27 dB ĻĄ¼Ļ░äņŚÉņä£ļŖö ņäĀĒśĢ ļ¬©ļŹĖņØś RMSEĻ░Ć Ļ░Ćņן ļé«ņĢśļŗż(ļ¬©ļōĀ P<0.05) (Fig. 4A). 3ļģä Ēøä ņśłņĖĪņØś Ļ▓ĮņÜ░, ņ┤łĻĖ░ ņŚŁņ╣śĻ░ÆņØ┤ 0-11 dB, 28-31 dBņØĖ ĻĄ¼Ļ░äņŚÉņä£ ņ¦ĆņłśĒśĢ ļ¬©ļŹĖņØ┤ Ļ░Ćņן ļé«ņØĆ RMSEļź╝ ļ│┤ņśĆļŗż(ļ¬©ļōĀp<0.05). 5ļģä Ēøä ņśłņĖĪņØś Ļ▓ĮņÜ░ 4-7 dBņØä ņĀ£ņÖĖĒĢ£ ļ¬©ļōĀ ĻĄ¼Ļ░äņŚÉņä£ ņ¦ĆņłśĒśĢ ļ¬©ļŹĖņØ┤ Ļ░Ćņן ļé«ņØĆ RMSEļź╝ ļ│┤ņśĆļŗż(ļ¬©ļōĀ p<0.05) (Fig. 4B).
ņŗ£ņĢ╝Ļ▓Ćņé¼ 52Ļ░£ ņ¦ĆņĀÉņØä ņżæņŗ¼ļČĆ 12Ļ░£ ņ¦ĆņĀÉĻ│╝ ņŻ╝ļ│ĆļČĆ 40Ļ░£ ņ¦ĆņĀÉņØś ļæÉ ņśüņŚŁņ£╝ļĪ£ ļéśļłł Ēøä, Ļ░ü ņśüņŚŁņŚÉņä£ ņäĀĒśĢĻ│╝ ņ¦ĆņłśĒśĢ ļ¬©ļŹĖņØś ņśłņĖĪ RMSEļź╝ ļ╣äĻĄÉĒĢśņśĆļŗż(Table 4). 1ļģä ņ░© ņśłņĖĪņŚÉņä£ ņŻ╝ļ│ĆļČĆ ņŗ£ņĢ╝ņŚÉņä£ļŖö ņäĀĒśĢ ļ¬©ļŹĖņØś RMSEĻ░Ć ņ¦ĆņłśĒśĢ ļ¬©ļŹĖļ│┤ļŗż ļŹö ļé«ņĢśĻ│Ā(p<0.001), ņżæņŗ¼ļČĆ ņŗ£ņĢ╝ņŚÉņä£ļŖö ļæÉ ļ¬©ļŹĖ Ļ░äņØś RMSE ņ░©ņØ┤Ļ░Ć ņŚåņŚłļŗż. 2ļģä ņ░© ņśłņĖĪņŚÉņä£ ņŻ╝ļ│ĆļČĆ ņŗ£ņĢ╝ņŚÉņä£ļŖö ļæÉ ļ¬©ļŹĖ Ļ░äņØś ņ░©ņØ┤Ļ░Ć ņŚåņŚłņ£╝ļéś, ņżæņŗ¼ļČĆ ņŗ£ņĢ╝ņŚÉņä£ļŖö ņ¦ĆņłśĒśĢ ļ¬©ļŹĖņØś RMSEĻ░Ć ņäĀĒśĢļ¬©ļŹĖļ│┤ļŗż ļŹö ļé«ņĢśļŗż(p=0.015). 3, 5ļģä ņ░© ņśłņĖĪņŚÉņä£ ņżæņŗ¼ļČĆņÖĆ ņŻ╝ļ│ĆļČĆ ņŗ£ņĢ╝ ļ¬©ļæÉņŚÉņä£ ņ¦ĆņłśĒśĢ ļ¬©ļŹĖņØś RMSEĻ░Ć ņäĀĒśĢ ļ¬©ļŹĖļ│┤ļŗż ļŹö ļé«ņĢśļŗż(ļ¬©ļōĀ p<0.001).
ņŗ£ņĢ╝Ļ▓Ćņé¼ Ļ░ü ņ¦ĆņĀÉļ¦łļŗż ņäĀĒśĢĻ│╝ ņ¦ĆņłśĒśĢ ļ¬©ļŹĖņØś ņśłņĖĪ RMSEļź╝ ļÅäņČ£ĒĢ£ Ēøä, ņżæņŗ¼ļČĆņÖĆ ņŻ╝ļ│ĆļČĆļĪ£ ņśüņŚŁņØä ļéśļłäņ¢┤ ņäĀĒśĢĻ│╝ ņ¦ĆņłśĒśĢ ļ¬©ļŹĖ ņé¼ņØ┤ņŚÉ ĒåĄĻ│äņĀüņ£╝ļĪ£ ņ£ĀņØśĒĢ£ RMSE ņ░©ņØ┤Ļ░Ć ņ׳ļŖö ņ¦ĆņĀÉņØś Ļ░£ņłśļź╝ ļ╣äĻĄÉ ļČäņäØĒĢśņśĆļŗż(Fig. 5). ņśłņĖĪ ĻĖ░Ļ░äņØ┤ ĻĖĖņ¢┤ņ¦łņłśļĪØ ņ¦ĆņłśĒśĢ ļ¬©ļŹĖņØ┤ ņÜ░ņäĖĒĢ£ ņ¦ĆņĀÉņØś ņłśĻ░Ć ņ”ØĻ░ĆĒĢśņśĆļŗż. 1ļģä ņ░© ņśłņĖĪņŚÉņä£ ņżæņŗ¼ļČĆ 12Ļ░£ ņ¦ĆņĀÉ ņżæ 1Ļ░£ ņ¦ĆņĀÉ(8.33%)ņŚÉņä£ ņ¦ĆņłśĒśĢ ļ¬©ļŹĖņØś RMSEĻ░Ć ņäĀĒśĢ ļ¬©ļŹĖļ│┤ļŗż ļŹö ļé«ņĢśĻ│Ā, ņŻ╝ļ│ĆļČĆ 40Ļ░£ ņ¦ĆņĀÉ ņżæ 3Ļ░£ ņ¦ĆņĀÉ(7.5%)ņŚÉņä£ ņäĀĒśĢ ļ¬©ļŹĖņØś RMSEĻ░Ć ņ¦ĆņłśĒśĢ ļ¬©ļŹĖļ│┤ļŗż ļŹö ļé«ņĢśļŗż. 2ļģä ņ░© ņśłņĖĪņŚÉņä£ ņżæņŗ¼ļČĆ 12Ļ░£ ņ¦ĆņĀÉ ņżæ 3Ļ░£ ņ¦ĆņĀÉ(25%)Ļ│╝ ņŻ╝ļ│ĆļČĆ 40Ļ░£ ņ¦ĆņĀÉ ņżæ 2Ļ░£ ņ¦ĆņĀÉ(5%)ņŚÉņä£ ņ¦ĆņłśĒśĢ ļ¬©ļŹĖņØś RMSEĻ░Ć ņäĀĒśĢ ļ¬©ļŹĖļ│┤ļŗż ļŹö ļé«ņĢśļŗż. 3ļģä ņ░© ņśłņĖĪņŚÉņä£ ņżæņŗ¼ļČĆ 12Ļ░£ ņ¦ĆņĀÉ ņżæ 4Ļ░£ ņ¦ĆņĀÉ(33.3%)Ļ│╝ ņŻ╝ļ│ĆļČĆ 40Ļ░£ ņ¦ĆņĀÉ ņżæ 2Ļ░£ ņ¦ĆņĀÉ(20%)ņŚÉņä£ ņ¦ĆņłśĒśĢ ļ¬©ļŹĖņØś RMSEĻ░Ć ņäĀĒśĢ ļ¬©ļŹĖļ│┤ļŗż ļŹö ļé«ņĢśļŗż. 5ļģä ņ░© ņśłņĖĪņŚÉņä£ ņżæņŗ¼ļČĆ 12Ļ░£ ņ¦ĆņĀÉ ņżæ 7Ļ░£ ņ¦ĆņĀÉ(58.3%)Ļ│╝ ņŻ╝ļ│ĆļČĆ 40Ļ░£ ņ¦ĆņĀÉ ņżæ 21Ļ░£ ņ¦ĆņĀÉ(52.5%)ņŚÉņä£ ņ¦ĆņłśĒśĢ ļ¬©ļŹĖņØś RMSEĻ░Ć ņäĀĒśĢ ļ¬©ļŹĖļ│┤ļŗż ļŹö ļé«ņĢśļŗż.
Ļ│Ā ņ░░
ļ│Ė ņŚ░ĻĄ¼ Ļ▓░Ļ│╝ņŚÉ ļö░ļź┤ļ®┤ ņŗ£Ļ░äņŚÉ ļö░ļźĖ ņŗ£ņĢ╝Ļ▓Ćņé¼ ņŚŁņ╣śĻ░ÆņØä ņäĀĒśĢ, ņ¦ĆņłśĒśĢ, ļŗżĒĢŁĒśĢ ĒÜīĻĘĆ ļ¬©ļŹĖņØä ņØ┤ņÜ®ĒĢśņŚ¼ Ļ░üĻ░ü ņĀüĒĢ® ņŗ£ņŚÉ ļŗżĒĢŁĒśĢ ļ¬©ļŹĖņØ┤ Ļ░Ćņן ņóŗņØĆ ņĀüĒĢ®ņØä ļ│┤ņśĆņ£╝ļ®░, ņ┤łĻĖ░ ņŚŁņ╣śĻ░ÆņØ┤ ļåÆņØäņłśļĪØ ļŹö ņóŗņØĆ ņĀüĒĢ®ņØä ļ│┤ņśĆņ£╝ļéś, ņśłņĖĪ ņŗ£ņŚÉļŖö ļŗżĒĢŁĒśĢ ļ¬©ļŹĖņØ┤ Ļ░Ćņן ļé«ņØĆ ņä▒ļŖźņØä ļ│┤ņśĆļŗż.
ņäĀĒśĢĻ│╝ ņ¦ĆņłśĒśĢ ļ¬©ļŹĖņØś ņśłņĖĪņØä ļ╣äĻĄÉĒĢśņśĆņØä ļĢī, ļŗ©ĻĖ░ ņśłņĖĪņØĆ ņäĀĒśĢ ļ¬©ļŹĖņØ┤ ļŹö ņÜ░ņłśĒĢśņśĆņ£╝ļéś, ņןĻĖ░ ņśłņĖĪ ņä▒ļŖźņØĆ ņ¦ĆņłśĒśĢ ļ¬©ļŹĖņØ┤ ļŹö ņÜ░ņłśĒĢśņśĆļŗż. ņĄ£ņ┤ł ņŗ£ņĢ╝Ļ▓Ćņé¼ņØś ņŚŁņ╣śĻ░Ć ļé«ņØäņłśļĪØ ņ¦ĆņłśĒśĢ ļ¬©ļŹĖņØ┤, ļåÆņØäņłśļĪØ ņäĀĒśĢ ļ¬©ļŹĖņØ┤ ņÜ░ņłśĒĢ£ ņśłņĖĪ ņä▒ļŖźņØä ļ│┤ņśĆļŗż. ņŗ£ņĢ╝ ņŻ╝ļ│ĆļČĆņØś ļŗ©ĻĖ░ ņśłņĖĪņŚÉļŖö ņäĀĒśĢ ļ¬©ļŹĖņØ┤ ļŹö ņÜ░ņøöĒĢśņśĆņ£╝ļéś, ņןĻĖ░ ņśłņĖĪņŚÉņä£ļŖö ņ¦ĆņłśĒśĢ ļ¬©ļŹĖņØ┤ ļŹö ņÜ░ņłśĒĢśņśĆļŗż. ņŗ£ņĢ╝ ņżæņŗ¼ļČĆ ņśłņĖĪņŚÉņä£ļŖö ņ¦ĆņłśĒśĢ ļ¬©ļŹĖņØ┤ ņäĀĒśĢ ļ¬©ļŹĖļ│┤ļŗż ļŹö ļø░ņ¢┤ļé£ ņä▒ļŖźņØä ļ│┤ņśĆļŗż.
ņäĀĒśĢ, ņ¦ĆņłśĒśĢ, ļŗżĒĢŁĒśĢ ļ¬©ļŹĖņØä ņØ┤ņÜ®ĒĢśņŚ¼ ņŗ£ņĢ╝Ļ▓Ćņé¼ ņĀä ĻĄ¼Ļ░äņŚÉ ļīĆĒĢśņŚ¼ ņĀüĒĢ®ņØä ņŗ£Ē¢ē ņŗ£ņŚÉ ļŗżĒĢŁĒśĢ ļ¬©ļŹĖņØ┤ Ļ░Ćņן ņóŗņØĆ ņĀüĒĢ®ļÅäļź╝ ļ│┤ņśĆļŗż. ĻĘĖ ņØ┤ņ£ĀļŖö ļŗżĒĢŁĒśĢ ļ¬©ļŹĖņØ┤ ļ¬©ļŹĖ ĒÜīĻĘĆļČäņäØņØä ĒĢĀ ļĢī ņäĀĒśĢņØ┤ļéś ņ¦ĆņłśĒśĢ ļ¬©ļŹĖņŚÉ ļ╣äĒĢ┤ņä£ 1Ļ░£ ļŹö ļ¦ÄņØĆ Ļ│äņłśļź╝ Ļ░Ćņ¦ĆĻ│Ā ņ׳ĻĖ░ ļĢīļ¼ĖņØ┤ļŗż[21]. ļŗżĒĢŁĒśĢ ļ┐Éļ¦īņØ┤ ņĢäļŗłļØ╝ ļĪ£ĻĘĖĒśĢ ļ¬©ļŹĖņØä ņØ┤ņÜ®ĒĢśņŚ¼ ņĀüĒĢ®ņØä ņŗ£ļÅäĒĢ£ ņŚ░ĻĄ¼ņŚÉņä£ļÅä ļĪ£ĻĘĖĒśĢ ļ¬©ļŹĖņØ┤ ņäĀĒśĢņØ┤ļéś ņ¦ĆņłśĒśĢ ļ¬©ļŹĖņŚÉ ļ╣äĒĢśņŚ¼ ļ¬©ļŹĖ ĒÜīĻĘĆ ņŗ£ņŚÉ 1Ļ░£ ļŹö ļ¦ÄņØĆ Ļ│äņłśļź╝ Ļ░Ćņ¦Ćļ»ĆļĪ£ Ļ░Ćņן ļø░ņ¢┤ļé£ ņĀüĒĢ®ļÅäļź╝ ļ│┤ņśĆļŗż[14]. ĒĢśņ¦Ćļ¦ī ņĀüĒĢ®ļÅäĻ░Ć Ļ░Ćņן ļåÆņØĆ ļ¬©ļŹĖņØ┤ Ļ░Ćņן ņóŗņØĆ ņśłņĖĪņØä ĒĢśļŖö Ļ▓āņØĆ ņĢäļŗłļŗż. ņØ┤ļź╝ ĒåĄĻ│äņĀüņ£╝ļĪ£ Ļ│╝ņĀüĒĢ®ņØś ļ¼ĖņĀ£ļØ╝Ļ│Ā ĒĢśļ®░, ļ│Ė ņŚ░ĻĄ¼ņÖĆ ļŹöļČłņ¢┤ ļŗżļźĖ ņŗ£ņĢ╝Ļ▓Ćņé¼ ļ¬©ļŹĖļ¦ü ņŚ░ĻĄ¼ņŚÉņä£ļÅä Ļ░Ćņן ņóŗņØĆ ņĀüĒĢ®ņØä ļ│┤ņØĖ ļ¬©ļŹĖņØ┤ ņśłņĖĪņŚÉņä£ļŖö ņÜ░ņłśĒĢ£ ņä▒ļŖźņØä ļ│┤ņØ┤ņ¦Ć ņĢŖņĢśļŗż[21,22].
ņśłņĖĪ ņä▒ļŖźņŚÉ Ļ┤ĆĒĢśņŚ¼ ņäĀĒśĢĻ│╝ ņ¦ĆņłśĒśĢ ļ¬©ļŹĖ ņżæ ņ¢┤ļŖÉ ļ¬©ļŹĖņØ┤ ļŹö ņÜ░ņłśĒĢ£ņ¦ĆņŚÉ ļīĆĒĢ┤ņä£ ņŚ¼ļ¤¼ ļģ╝ļ¼ĖļōżņØ┤ ļŗżņ¢æĒĢ£ Ļ▓░Ļ│╝ļź╝ ņĀ£ņŗ£ĒĢśņśĆļŗż. McNaught et al [22]Ļ│╝ Bryan et al [23]ņØĆ ņ¦ĆņłśĒśĢ ļ¬©ļŹĖĻ│╝ ļ╣äĻĄÉĒĢśņŚ¼ ņäĀĒśĢ ļ¬©ļŹĖņØ┤ ņśłņĖĪ ņä▒ļŖźņØ┤ ļŹö ņÜ░ņłśĒ¢łļŗżĻ│Ā ļ│┤Ļ│ĀĒĢśņśĆļŗż. McNaught et al [22]ņØś ņŚ░ĻĄ¼ļŖö ļ│Ė ņŚ░ĻĄ¼ņØś 1-2ļģä ņ░© ņśłņĖĪĻ│╝ ļ╣äņŖĘĒĢ£ ņŗ£ĻĖ░ņŚÉ ņśłņĖĪņØä ņŗ£ļÅäĒĢśņśĆĻ│Ā, ņØ┤ ņŚ░ĻĄ¼ļŖö 1ļģä ņ░© ņśłņĖĪņŚÉņä£ ņäĀĒśĢ ļ¬©ļŹĖņØ┤ ņÜ░ņłśĒĢ£ ņä▒ļŖźņØä ļ│┤ņØĖ ļ│Ė ņŚ░ĻĄ¼ Ļ▓░Ļ│╝ņÖĆ ņ£Āņé¼ĒĢ£ Ļ▓░Ļ│╝ļź╝ ļ│┤ņśĆļŗż. Bryan et al [23]ņØś ņŚ░ĻĄ¼ņŚÉņä£ļŖö ļ│Ė ņŚ░ĻĄ¼ņØś ļīĆļץ 2-3ļģä ņ░© ņśłņĖĪņŚÉ ĒĢ┤ļŗ╣ĒĢśļŖö ņŗ£ĻĖ░ņŚÉ ņśłņĖĪņØä ņŗ£Ē¢ēĒĢśņŚ¼ ņäĀĒśĢ ļ¬©ļŹĖņØś ņśłņĖĪ ņä▒ļŖźņØ┤ ļŹö ņÜ░ņłśĒĢ©ņØä ļ│┤ņśĆĻ│Ā, ņØ┤ļŖö ļ│Ė ņŚ░ĻĄ¼ Ļ▓░Ļ│╝ņÖĆļŖö ņØ╝ņ╣śĒĢśņ¦Ć ņĢŖņĢśļŗż.
ņ¦äĒ¢ēļÉ£ ļģ╣ļé┤ņן ĒÖśņ×ÉļōżņØä ļīĆņāüņ£╝ļĪ£ ņŗ£ņĢ╝Ļ▓░ņåÉ ņ¦äĒ¢ēņØä ņśłņĖĪĒĢ£ AGIS ņŚ░ĻĄ¼ļōżņŚÉņä£ ņäĀĒśĢ ļ¬©ļŹĖņŚÉ ļ╣äĒĢ┤ ņ¦ĆņłśĒśĢ ļ¬©ļŹĖņØ┤ ņśłņĖĪņŚÉ ļŹö ņÜ░ņłśĒĢ£ ņä▒ļŖźņØä ļ│┤ņśĆļŗż[13,14,16]. ņØ┤ņŚÉ ļ│Ė ņŚ░ĻĄ¼ņŚÉņä£ļÅä 1, 2ļģä ĒøäņØś ļŗ©ĻĖ░ ņśłņĖĪņŚÉņä£ ņ┤łĻĖ░ ņŚŁņ╣śĻ░ÆņØ┤ ļé«ņĢśļŹś ņ¦ĆņĀÉ(0-7 dB)ņŚÉņä£ļŖö ņ¦ĆņłśĒśĢ ļ¬©ļŹĖņØ┤, ņ┤łĻĖ░ ņŚŁņ╣śĻ░ÆņØ┤ ļåÆņĢśļŹś ņ¦ĆņĀÉ(20-27 dB)ņŚÉņä£ļŖö ņäĀĒśĢ ļ¬©ļŹĖņØ┤ ļŹö ņśłņĖĪ ņä▒ļŖźņØ┤ ļø░ņ¢┤ļé¼ļŗż. ņ┤łĻĖ░ ņŚŁņ╣śĻ░ÆņØ┤ ļåÆņĢśļŹś ņ¦ĆņĀÉņØ┤ļØ╝ļÅä 5ļģä ĒøäņØś ņןĻĖ░ ņśłņĖĪņŚÉņä£ļŖö ņ¦ĆņłśĒśĢ ļ¬©ļŹĖņØ┤ ņÜ░ņłśĒĢ£ ņä▒ļŖźņØä ļ│┤ņśĆļŗż. Chen et al [14]ņØĆ ĒÖśņ×ÉņØś ļģ╣ļé┤ņןņä▒ ņŗ£ņĢ╝Ļ▓░ņåÉņØś ļŗ©Ļ│äĻ░Ć ņŗ£ņĢ╝Ļ▓Ćņé¼ ņāüņØś ņŗżļ¬ģ(perimetric blindness)ņØä Ē¢źĒĢ┤ Ļ░ĆļŖö Ļ▓ĮņÜ░, ņĀÉĻĘ╝ņĀüņØĖ ņ¢æņāü(asymptotic trend)ņØä ļö░ļź┤ĻĖ░ ļĢīļ¼ĖņŚÉ ņ¦ĆņłśĒśĢ Ēś╣ņØĆ ļĪ£ĻĘĖĒśĢ Ļ░ÖņØĆ ĒÜīĻĘĆ ļ¬©ļŹĖņØ┤ ļŹö ņĀüĒĢ®ĒĢĀ Ļ▓āņØ┤ļØ╝Ļ│Ā ĒĢśņśĆļŗż. ņØ┤ļĀćĻ▓ī ļé«ņØĆ ņ┤łĻĖ░ ņŚŁņ╣śĻ░ÆņØä Ļ░Ćņ¦ä Ļ▓ĮņÜ░ Ēś╣ņØĆ ņןĻĖ░ ņśłņĖĪņØĖ Ļ▓ĮņÜ░ņŚÉņä£ ņŗ£ņĢ╝Ļ▓Ćņé¼ ņĢģĒÖö ņ¢æņāüņØ┤ ņĀÉĻĘ╝ņĀüņØĖ ņ¢æņāüņØä ļØäļŖö ņØ┤ņ£ĀļĪ£ļŖö ņŗ£ņĢ╝Ļ▓Ćņé¼ ņŚŁņ╣śĻ░ÆņØ┤ 0 dBņØ┤ļØ╝ļŖö ĒĢśĒĢ£(floor)ņØä Ļ░Ćņ¦ĆĻ│Ā ņ׳ņ£╝ļ®░ ņŚŁņ╣śĻ░ÆņØ┤ ļé«ņØĆ ĻĄ¼Ļ░äņŚÉņä£ļŖö ņŗĀĒśĖ ļīĆ ņ×ĪņØīļ╣ä(signal-to-noise ratio)Ļ░Ć ļé«ņĢä Ļ▓Ćņé¼ Ļ▓░Ļ│╝ņØś ļ│ĆļÅÖņä▒(fluctuation)ņØ┤ ļåÆĻĖ░ ļĢīļ¼ĖņØĖ Ļ▓āņ£╝ļĪ£ ņäżļ¬ģļÉ£ļŗż[11,14].
ņŗ£ņĢ╝Ļ▓Ćņé¼ ņ¦ĆņĀÉņØä ņżæņŗ¼ļČĆņÖĆ ņŻ╝ļ│ĆļČĆļĪ£ ļéśļłäņ¢┤ ņäĀĒśĢĻ│╝ ņ¦ĆņłśĒśĢ ļ¬©ļŹĖņØś ņśłņĖĪ ņä▒ļŖźņØä ļ╣äĻĄÉĒĢśņśĆņØä ļĢī, ņŻ╝ļ│ĆļČĆņØś Ļ▓ĮņÜ░ ņśłņĖĪ ņ┤łĻĖ░ņŚÉļŖö ņäĀĒśĢ ļ¬©ļŹĖņØ┤ ņÜ░ņłśĒĢśņśĆĻ│Ā ņØ┤Ēøä ļæÉ ļ¬©ļŹĖ ņé¼ņØ┤ņŚÉ ņ░©ņØ┤Ļ░Ć ņŚåņ¢┤ņ¦ä ļÆż ņןĻĖ░ ņśłņĖĪņŚÉņä£ļŖö ņ¦ĆņłśĒśĢ ļ¬©ļŹĖņØ┤ ņÜ░ņłśĒĢśņśĆļŗż. ļ░śļ®┤ņŚÉ ņżæņŗ¼ļČĆļŖö 1ļģä ļŗ©ĻĖ░ ņśłņĖĪņŚÉņä£ļŖö ļæÉ ļ¬©ļŹĖņØś ņä▒ļŖź ņ░©ņØ┤Ļ░Ć ņŚåņŚłĻ│Ā 2ļģäņ░© ņśłņĖĪļČĆĒä░ ņ¦ĆņłśĒśĢ ļ¬©ļŹĖņØ┤ ļŹö ņÜ░ņłśĒĢśņśĆļŗż. 1ļģä ļŗ©ĻĖ░ ņśłņĖĪņŚÉņä£ļÅä ņżæņŗ¼ļČĆ 12Ļ░£ ņ¦ĆņĀÉ ņżæ 1Ļ░£ ņ¦ĆņĀÉ(8.33%)ņŚÉņä£ ņ¦ĆņłśĒśĢ ļ¬©ļŹĖņØś ņśłņĖĪ ņä▒ļŖźņØ┤ ņäĀĒśĢ ļ¬©ļŹĖļ│┤ļŗż ņÜ░ņøöĒĢśņśĆĻ│Ā, ņäĀĒśĢ ļ¬©ļŹĖņØś ņśłņĖĪ ņä▒ļŖźņØ┤ ļŹö ņÜ░ņøöĒĢ£ ņ¦ĆņĀÉņØĆ ņŚåņŚłļŗż.
ņĀĢņāüņĢłņĢĢļģ╣ļé┤ņןņØś Ļ▓ĮņÜ░ ņøÉļ░£Ļ░£ļ░®Ļ░üļģ╣ļé┤ņןņŚÉ ļ╣äĒĢ┤ ņŗ£ņĢ╝ Ļ▓░ņåÉņØś ņ¦äĒ¢ēņØ┤ ņŗ£ņĢ╝ņØś ņżæņŗ¼ļČĆņŚÉņä£ ļŹö ņ×ÉņŻ╝ ļ░£ņāØĒĢśĻ│Ā, ļÅÖņ¢æņØĖņŚÉņä£ ņØ┤ļ¤░ ņĀĢņāüņĢłņĢĢļģ╣ļé┤ņןņØś ļ╣äņ£©ņØ┤ ļåÆņØĆ Ļ▓āņ£╝ļĪ£ ņĢīļĀżņĀĖ ņ׳ļŗż[17,24-26]. ļŹöļČłņ¢┤ ĻĘ╝ņŗ£ļź╝ ļÅÖļ░śĒĢ£ ļģ╣ļé┤ņןņØś Ļ▓ĮņÜ░ ņ£ĀļæÉĒÖ®ļ░śņä¼ņ£Ā(papillomacular bundle) ļČĆņ£ä ņåÉņāüņØ┤ ļæÉļō£ļ¤¼ņĀĖ ņżæņŗ¼ļČĆ ņŗ£ņĢ╝ ņĢģĒÖöĻ░Ć ņĪ░ĻĖ░ņŚÉ ļéśĒāĆļéĀ ņłś ņ׳Ļ│Ā, ĻĘ╝ņŗ£ ļśÉĒĢ£ ļÅÖņ¢æņØĖņŚÉņä£ ļ╣łļÅäĻ░Ć ļåÆļŗż[18,27-29]. ĒĢ£ĻĄŁņØĖņØä ļīĆņāüņ£╝ļĪ£ ĒĢ£ ļ│Ė ņŚ░ĻĄ¼ņŚÉņä£ ņĀĢņāü ņĢłņĢĢļģ╣ļé┤ņן ļ░Å ĻĘ╝ņŗ£ņØś ļ╣äņ£©ņØ┤ ļåÆņØä Ļ▓āņ£╝ļĪ£ ņČöņĀĢļÉśļ®░ ņØ┤ņŚÉ ņżæņŗ¼ļČĆ ņśłņĖĪņŚÉņä£ ņ¦ĆņłśĒśĢ ļ¬©ļŹĖņØ┤ ņäĀĒśĢ ļ¬©ļŹĖļ│┤ļŗż ļŹö ņÜ░ņłśĒ¢łļŹś Ļ▓āņ£╝ļĪ£ ņāØĻ░üļÉ£ļŗż. ļ│Ė ņŚ░ĻĄ¼ Ļ▓░Ļ│╝ļź╝ ļ░öĒāĢņ£╝ļĪ£ ņżæņŗ¼ļČĆ ņåÉņāüņØ┤ ĒśĖļ░£ĒĢśļŖö ņĀĢņāüņĢłņĢĢļģ╣ļé┤ņןĻ│╝ ĻĘ╝ņŗ£ ļģ╣ļé┤ņן ĒÖśņ×É, ĻĘĖļ”¼Ļ│Ā ņŗ¼ĒĢ£ ļģ╣ļé┤ņןņä▒ ņŗ£ņŗĀĻ▓Į ņåÉņāüņØä Ļ░Ćņ¦ĆĻ│Ā ņ׳ļŖö ĒÖśņ×ÉņŚÉņä£ ņäĀĒśĢ ļ¬©ļŹĖļ│┤ļŗż ņ¦ĆņłśĒśĢ ļ¬©ļŹĖņØ┤ ļģ╣ļé┤ņן ĒÖśņ×ÉņØś ņéČņØś ņ¦łĻ│╝ Ļ┤ĆļĀ© ņ׳ļŖö ņżæņŗ¼ļČĆ ņŗ£ņĢ╝ ņśłņĖĪņŚÉ ļŹö ļÅäņøĆņØ┤ ļÉĀ ņłś ņ׳ņØä Ļ▓āņ£╝ļĪ£ ņāØĻ░üļÉ£ļŗż[30].
ļ│Ė ņŚ░ĻĄ¼ ĒĢ£Ļ│äņĀÉņ£╝ļĪ£ļŖö ļ¬©ļŹĖņØä ļŗ©ņØ╝ ĒÜīĻĘĆņŗØņ£╝ļĪ£ ĻĄ¼ņä▒ĒĢśņŚ¼ ņŗ£ņĢ╝ ņĢģĒÖö ņåŹļÅäļź╝ ļé«ņČöļŖö ļģ╣ļé┤ņןņłśņłĀņØ┤ļéś ņŗ£ņĢ╝ ņŚŁņ╣śĻ░Æļź╝ ņ”ØĻ░Ćņŗ£ĒéżļŖö ļ░▒ļé┤ņןņłśņłĀ ļō▒ņØś ņśüĒ¢źņØ┤ ĻĄ¼ļČäļÉśņ¦Ć ņĢŖņĢśļŗżļŖö ņĀÉņØ┤ļŗż. ņØ┤ļź╝ Ļ│ĀļĀżĒĢśĻĖ░ ņ£äĒĢ┤ņä£ļŖö ņČöĒøä ļ│ĄĒĢ® ļ¬©ļŹĖ(multimodal functions)ņØä ņØ┤ņÜ®ĒĢ£ ĒøäņåŹ ņŚ░ĻĄ¼Ļ░Ć ĒĢäņÜöĒĢĀ Ļ▓āņ£╝ļĪ£ ņāØĻ░üļÉ£ļŗż. ļŹöļČłņ¢┤, ļ│Ė ņŚ░ĻĄ¼ņŚÉ ĒżĒĢ©ļÉ£ ļīĆļČĆļČäņØś ĒÖśņ×ÉļōżņØĆ ņ¦ĆņŚŁņØśņøÉņŚÉņä£ ņĢłņĢĢĒĢśĻ░ĢņĀ£ļź╝ ņé¼ņÜ®ĒĢśļŹś ņżæņŚÉ ļ│Ė ņŚ░ĻĄ¼Ļ░Ć ņŗ£Ē¢ēļÉ£ ļ│æņøÉņ£╝ļĪ£ ņĀäņøÉļÉ£ Ļ▓ĮņÜ░ļĪ£ ņøÉļ░£Ļ░£ļ░®Ļ░üļģ╣ļé┤ņןĻ│╝ ņĀĢņāüņĢłņĢĢļģ╣ļé┤ņןņØä ņĀĢĒÖĢĒ׳ ĻĄ¼ļČäĒĢśņŚ¼ ņŚ░ĻĄ¼ĒĢśņ¦Ć ļ¬╗ĒĢśņśĆļŹś ņĀÉņØ┤ ĒĢ£Ļ│äņĀÉņ£╝ļĪ£ ņāØĻ░üļÉ£ļŗż.
ļ│Ė ņŚ░ĻĄ¼ļŖö ĒĢ£ĻĄŁņØĖ ļģ╣ļé┤ņן ĒÖśņ×ÉļōżņØä ļīĆņāüņ£╝ļĪ£ ļģ╣ļé┤ņןņä▒ ņŗ£ņĢ╝Ļ▓░ņåÉ ņ¦äĒ¢ēņØä ņäĀĒśĢ, ņ¦ĆņłśĒśĢ, ļŗżĒĢŁĒśĢņØś ĒÜīĻĘĆļČäņäØņØä ņØ┤ņÜ®ĒĢśņŚ¼ ņĀüĒĢ®ņŗ£ĒéżĻ│Ā ņśłņĖĪņØä ņŗ£ļÅäĒĢ£ ņŚ░ĻĄ¼ņØ┤ļŗż. ļŗ©ĻĖ░ ņśłņĖĪ ņŗ£ņŚÉļŖö ņäĀĒśĢ ļ¬©ļŹĖņØ┤, ņןĻĖ░ ņśłņĖĪ ņŗ£ņŚÉļŖö ņ¦ĆņłśĒśĢ ļ¬©ļŹĖņØś ņśłņĖĪ ņä▒ļŖźņØ┤ ņÜ░ņłśĒĢśņśĆļŗż. ĻĘĖļ¤¼ļéś ņżæņŗ¼ļČĆ ņŗ£ņĢ╝ņØś Ļ▓ĮņÜ░ ņŻ╝ļ│ĆļČĆļ│┤ļŗż ņØ┤ļźĖ ņŗ£ĻĖ░ļČĆĒä░ ņ¦ĆņłśĒśĢ ļ¬©ļŹĖņØś ņśłņĖĪ ņä▒ļŖźņØ┤ ņäĀĒśĢ ļ¬©ļŹĖļ│┤ļŗż ļŹö ņÜ░ņøöĒĢśņśĆĻ│Ā, ņ┤łĻĖ░ ņŗ£ņĢ╝Ļ▓Ćņé¼ņØś ņŚŁņ╣śĻ░ÆņØ┤ ļé«ņØĆ Ļ▓ĮņÜ░ņŚÉļÅä ļåÆņØĆ Ļ▓ĮņÜ░ļ│┤ļŗż ņØ┤ļźĖ ņŗ£ĻĖ░ņŚÉ ņ¦ĆņłśĒśĢ ļ¬©ļŹĖņØś ņśłņĖĪ ņä▒ļŖźņØ┤ ņäĀĒśĢ ļ¬©ļŹĖļ│┤ļŗż ļŹö ņÜ░ņøöĒĢśņśĆļŗż. ļ│Ė ņŚ░ĻĄ¼ Ļ▓░Ļ│╝ļŖö Ē¢źĒøä ņČöĻ░Ć ņŚ░ĻĄ¼ļź╝ ĒåĄĒĢśņŚ¼ ĒĢ£ĻĄŁņØĖ ļģ╣ļé┤ņן ĒÖśņ×ÉņØś ņŗ£ņĢ╝Ļ▓░ņåÉ ņ¦äĒ¢ēņŚÉ ļīĆĒĢ£ ņĀĢļ│┤ļź╝ ņĀ£Ļ│ĄĒĢśļŖö ļŹ░ ņ£ĀņÜ®ĒĢśĻ▓ī ņé¼ņÜ®ļÉĀ ņłś ņ׳ņØä Ļ▓āņ£╝ļĪ£ ņāØĻ░üļÉ£ļŗż.

 PDF Links
 PubReader
 ePub Link
 Full text via DOI
 Download Citation
 Print
Print