


ņĀĢņāüņĢłņĢĢļģ╣ļé┤ņן(normal tension glaucoma, NTG)ņØĆ ņĢłņĢĢņØ┤ 21 mmHg ņØ┤ĒĢśņØ┤Ļ│Ā ņĀäļ░®Ļ░üņØĆ ņŚ┤ļĀż ņ׳ņ£╝ļ®░[1], ĒŖ╣ņ¦ĢņĀüņØĖ ļģ╣ļé┤ņןņä▒ ņŗ£ņŗĀĻ▓Į ņåÉņāüĻ│╝ ĻĘĖņŚÉ ņāüņØæĒĢśļŖö ņŗ£ņĢ╝Ļ▓░ņåÉņØä ņ£Āļ░£ĒĢśļŖö ņ¦äĒ¢ēņä▒ ņ¦łĒÖśņ£╝ļĪ£[2] ļ│æĒā£ņāØļ”¼ĒĢÖņĀüņØĖ ņøÉņØĖņØĆ ņÖäņĀäĒ׳ ĻĘ£ļ¬ģļÉśņ¢┤ ņ׳ņ¦Ć ņĢŖņ¦Ćļ¦ī ĒśłĻ┤Ćņä▒ ņ×Éņ£©ņĪ░ņĀłņןņĢĀ(vascular dysregulation), ņŗ£ņŗĀĻ▓Įņ£ĀļæÉ ļ░Å ņŻ╝ļ│ĆļČĆņØś ĒĢ┤ļČĆĒĢÖņĀü ņ░©ņØ┤, ņ×ÉĻ░Ćļ®┤ņŚŁņä▒ ĒśłĻ┤Ćņ¦łĒÖś, ņĀäņŗĀņĀüņØĖ ņĀĆĒśłņĢĢĻ│╝ Ļ░ÖņØĆ ņĀäņŗĀņĀüņØĖ ĒśłĻ┤ĆņØś ņØ┤ņāüņØ┤ ņ¦Ćļ¬®ļÉ£ ļ░ö ņ׳ļŗż[3].
ļ╣øĻ░äņäŁļŗ©ņĖĄĒśłĻ┤ĆņĪ░ņśüņłĀņØĆ ļ¦Øļ¦ēļ¬©ņäĖĒśłĻ┤Ć ĻĄ¼ņĪ░ļź╝ ļ╣Āļź┤Ļ│Ā ļ╣äņ╣©ņŖĄņĀüņ£╝ļĪ£ Ļ▓Ćņé¼ĒĢĀ ņłś ņ׳ņ£╝ļ®░, ļé┤ņןļÉ£ ņåīĒöäĒŖĖņø©ņ¢┤ļź╝ ņØ┤ņÜ®ĒĢśņŚ¼ ļŗ©ņ£ä ļ®┤ņĀüņŚÉņä£ ĒśłĻ┤ĆņØś ĻĖĖņØ┤ļĪ£ Ēæ£ņŗ£ļÉśļŖö ĒśłĻ┤Ćļ░ĆļÅä(vessel density, VD), ĒĢ┤ļŗ╣ ļ®┤ņĀüņŚÉņä£ ļ¦Øļ¦ē ĒśłĻ┤Ć ļé┤ņØś ņĀüĒśłĻĄ¼ņØś ņøĆņ¦üņ×äņØä ļ│┤ņØĖ ļ®┤ņĀüņØä ļéśĒāĆļé┤ļŖö Ļ┤Ćļźśļ░ĆļÅä(perfusion density, PD), ņśżļ¬®ļ¼┤ĒśłĻ┤ĆļČĆņ£ä(foveal avascular zone, FAZ)ņÖĆ Ļ░ÖņØĆ ņłśņ╣śļź╝ ĒåĄĒĢ£ ļ¦Øļ¦ēņØś ĒśłļźśņŚÉ ļīĆĒĢ£ ĒÅēĻ░ĆĻ░Ć Ļ░ĆļŖźĒĢśļŗż[4]. ņØ┤ļ¤¼ĒĢ£ ļ╣øĻ░äņäŁļŗ©ņĖĄĒśłĻ┤ĆņĪ░ņśüņłĀņØä ĒåĄĒĢśņŚ¼ ņ¢╗ņØĆ Ļ▓░Ļ│╝ļŖö ņĪ░ņśüņĀ£ļź╝ ņØ┤ņÜ®ĒĢ£ ĻĖ░ņĪ┤ņØś ĒśĢĻ┤æĒśłĻ┤ĆņĪ░ņśüņłĀĻ│╝ ņØ╝ņ╣śĒĢśļŖö ņåīĻ▓¼ņØä ļ│┤ņØĖļŗż[5]. ļśÉĒĢ£ ļ╣øĻ░äņäŁļŗ©ņĖĄĒśłĻ┤ĆņĪ░ņśüņłĀņØĆ ļ¦Øļ¦ēņ¦łĒÖśņØś ņ¦äļŗ© ļ░Å Ļ▓Ćņé¼ ļ┐Éļ¦ī ņĢäļŗłļØ╝, ļģ╣ļé┤ņןņØä ņ¦äļŗ©ĒĢśĻ│Ā ņ¦äĒ¢ēņØä Ļ░Éņ¦ĆĒĢśļ®░, ņ¦äĒ¢ē ņ£äĒŚśņØä ĒÅēĻ░ĆĒĢśĻĖ░ ņ£äĒĢśņŚ¼ ņé¼ņÜ®ļÉśņ¢┤ ņÖöļŗż[6]. ļ╣øĻ░äņäŁļŗ©ņĖĄĒśłĻ┤ĆņĪ░ņśüņłĀņØä ņØ┤ņÜ®ĒĢ£ ņŚ░ĻĄ¼ļōżņŚÉņä£ ļģ╣ļé┤ņן ĒÖśņ×ÉņØś ņŗ£ņŗĀĻ▓Įņ£ĀļæÉ ņŻ╝ļ│ĆļČĆņØś Ļ┤ĆļźśĻ░Ć Ļ░ÉņåīļÉśņ¢┤ ņ׳ļŗżļŖö ļ│┤Ļ│ĀĻ░Ć ņ׳ņ¦Ćļ¦ī[7,8], ļŗ©ņĢł ņĀĢņāüņĢłņĢĢļģ╣ļé┤ņןņŚÉņä£ ļ╣øĻ░äņäŁļŗ©ņĖĄĒśłĻ┤ĆņĪ░ņśüņłĀņØä ĒåĄĒĢ£ ĒÖ®ļ░śļČĆ ļ░Å ņŗ£ņŗĀĻ▓Įņ£ĀļæÉ ņŻ╝ļ│ĆļČĆņØś ĒśłļźśņØĖņ×ÉņØś ņŚ░ĻĄ¼, ĒŖ╣Ē׳ ņĀĢņāü ļīĆņĪ░ĻĄ░Ļ│╝ ļģ╣ļé┤ņןņŚÉ ņØ┤ĒÖśļÉ£ ļ░śļīĆņĢłņØś ņŚ░ĻĄ¼ļŖö ņāüļīĆņĀüņ£╝ļĪ£ ĻĄŁļé┤ņÖĖ ļ│┤Ļ│ĀĻ░Ć ļō£ļ¼╝ļŗż.
ņØ┤ņŚÉ ņĀĢņāüņĢłņĢĢļģ╣ļé┤ņןņØś ļ░£ļ│æĻ│╝ ļ¦Øļ¦ēņØś Ēśłļźś ņé¼ņØ┤ņŚÉ Ļ┤ĆļĀ©ņØ┤ ņ׳ļŗżļ®┤, ļŗ©ņĢł ņĀĢņāüņĢłņĢĢļģ╣ļé┤ņןņŚÉņä£ ņØ┤ĒÖśņĢł ļ┐Éļ¦ī ņĢäļŗłļØ╝ ļ░śļīĆņĢłņŚÉļÅä ņśüĒ¢źņØä ļ»Ėņ╣Ā ņłś ņ׳ņØä Ļ▓āņ£╝ļĪ£ Ļ░ĆņĀĢĒĢśĻ│Ā, ļŗ©ņĢł ņĀĢņāüņĢłņĢĢļģ╣ļé┤ņן ĒÖśņ×ÉņØś ņØ┤ĒÖśņĢłĻ│╝ ļ░śļīĆņĢł, ļīĆņĪ░ĻĄ░ņŚÉņä£ ļ╣øĻ░äņäŁļŗ©ņĖĄĒśłĻ┤ĆņĪ░ņśüņłĀņØä ņØ┤ņÜ®ĒĢśņŚ¼ ĒÖ®ļ░śļČĆ ļ░Å ņŗ£ņŗĀĻ▓Įņ£ĀļæÉ ņŻ╝ļ│ĆļČĆņØś ļ¦Øļ¦ēļ¬©ņäĖĒśłĻ┤Ć ņØĖņ×ÉļōżņØä ļ╣äĻĄÉĒĢ┤ ļ│┤Ļ│Āņ×É ĒĢśņśĆļŗż.
ļīĆņāüĻ│╝ ļ░®ļ▓Ģ
ņØśļ¼┤ĻĖ░ļĪØņØä ĒøäĒ¢źņĀüņ£╝ļĪ£ ņĪ░ņé¼ĒĢśņŚ¼ 2017ļģä 1ņøöļČĆĒä░ 2020ļģä 6ņøöĻ╣īņ¦Ć ļŗ©ņØ╝ ĻĖ░Ļ┤ĆņŚÉ ļé┤ņøÉĒĢśņŚ¼ ļŗ©ņĢł ņĀĢņāüņĢłņĢĢļģ╣ļé┤ņןņ£╝ļĪ£ ņ¦äļŗ© ļ░øņØĆ ĒÖśņ×Éļź╝ ļīĆņāüņ£╝ļĪ£ ņŚ░ĻĄ¼ ĻĖ░ņżĆņŚÉ ņĀüĒĢ®ĒĢ£ 24ļ¬ģĻ│╝, ļÅÖņØ╝ ĻĖ░Ļ░ä ļé┤ņŚÉ ļÅÖņØ╝ ĻĖ░Ļ┤ĆņŚÉņä£ Ļ▓Ćņ¦ä ļ¬®ņĀüņ£╝ļĪ£ ņĢłĻ│╝ņĀü Ļ▓Ćņé¼ļź╝ ņŗ£Ē¢ē ļ░øņØĆ ņĀüņØ┤ ņ׳ļŖö ļīĆņāüņ×Éļōż ņżæņŚÉņä£ ņŚ░ĻĄ¼ ĻĖ░ņżĆņŚÉ ņĀüĒĢ®ĒĢ£ 29ļ¬ģņØä ņĀĢņāü ļīĆņĪ░ĻĄ░ņ£╝ļĪ£ ĒĢśņśĆļŗż. ļ│ĖņøÉņŚÉņä£ ņ▓śņØīņ£╝ļĪ£ ļŗ©ņĢł ņĀĢņāüņĢłņĢĢļģ╣ļé┤ņןņ£╝ļĪ£ ņ¦äļŗ© ļ░øņØĆ ĒÖśņ×Éļź╝ ĒÖśņ×ÉĻĄ░ņ£╝ļĪ£ ĒĢśņśĆĻ│Ā ņĢłĻ│╝ Ļ▓Ćņé¼ņÖĆ ļ│æļĀźņāü ņĢłĻ│╝ņĀü ņ¦łĒÖśņØ┤ ņŚåļŖö Ļ▓ĮņÜ░ļź╝ ņĀĢņāü ļīĆņĪ░ĻĄ░ņ£╝ļĪ£ ĒĢśņśĆļŗż.
ņ¢æĻĄ░ ļ¬©ļæÉ Ļ│╝Ļ▒░ ļ│æļĀź ņĪ░ņé¼, ņ¢æņĢł ņŗ£ļĀź, ĻĄ┤ņĀłļĀź, Ļ│©ļō£ļ¦īņĢłņĢĢĻ▓Ćņé¼, ņäĖĻĘ╣ļō▒Ļ▓Ćņé¼, ņĀäļ░®Ļ░üĻ▓Ćņé¼, ņé░ļÅÖ Ēøä ņĢłņĀĆĻ▓Ćņé¼, ļ╣øĻ░äņäŁļŗ©ņĖĄņ┤¼ņśüĻ▓Ćņé¼ ļ░Å ļ╣øĻ░äņäŁļŗ©ņĖĄņĪ░ņśüņłĀņØä ņŗ£Ē¢ē ļ░øņĢśļŹś Ļ▓ĮņÜ░ļź╝ ĒżĒĢ©ņŗ£ņ╝░Ļ│Ā ĻĄÉņĀĢņŗ£ļĀźņØ┤ Snellen ņŗ£ļĀź ĻĖ░ņżĆ 20/40 ļ»Ėļ¦ī, ĻĄ┤ņĀłļźĀņØ┤ ┬▒6ļööņśĄĒä░ ņØ┤ņāüņØĖ Ļ▓ĮņÜ░ļŖö ļ░░ņĀ£ĒĢśņśĆļŗż. ņĀäļ░®Ļ░üņØ┤ ņóüĻ▒░ļéś ņāēņåīņä▒ ņ╣©ņ░® ļō▒ņØś ņØ┤ņāüņØ┤ ļéśĒāĆļéśļŖö Ļ▓ĮņÜ░, ņĀĢņāüņĢłņĢĢļģ╣ļé┤ņן ņØ┤ņÖĖņØś ņØ┤ņĀä Ļ░üļ¦ē, ļ¦Øļ¦ē, ĒżļÅäļ¦ē, ņŗ£ņŗĀĻ▓Į ļō▒ņØś ņ¦łĒÖśņØ┤ ņ׳ļŖö Ļ▓ĮņÜ░, ļ░▒ļé┤ņןņłśņłĀ ņØ┤ņÖĖņØś ļŗżļźĖ ņĢłĻĄ¼ļé┤ ņłśņłĀ ĻĖ░ņÖĢļĀźņØ┤ ņ׳ļŖö Ļ▓ĮņÜ░, ņŗ£ņŗĀĻ▓ĮņØ┤ļéś ļ¦Øļ¦ēņŚÉ ņśüĒ¢źņØä ņżä ļ¦īĒĢ£ ņŗĀĻ▓ĮĻ│╝ņĀü ņ¦łĒÖśņØ┤ ņ׳ļŖö Ļ▓ĮņÜ░ļź╝ ņĀ£ņÖĖĒĢśņśĆļŗż. ĒÖśņ×ÉĻĄ░ņŚÉņä£ ļČäņäØņŚÉ ņé¼ņÜ®ĒĢ£ ņ×ÉļŻīļŖö ņĀĢņāüņĢłņĢĢļģ╣ļé┤ņן ņ¦äļŗ© ļŗ╣ņŗ£ņŚÉ ņĖĪņĀĢĒĢ£ Ļ░ÆņØä ņé¼ņÜ®ĒĢśņśĆĻ│Ā ĒÖśņ×ÉĻĄ░ņŚÉņä£ ņĀĢņāüņĢłņĢĢļģ╣ļé┤ņןņŚÉ ņØ┤ĒÖśļÉ£ ņØ┤ĒÖśņĢłĻ│╝ ĻĘĖļĀćņ¦Ć ņĢŖņØĆ ļ░śļīĆņĢł, ņĀĢņāü ļīĆņĪ░ĻĄ░ ņżæņŚÉņä£ ņ¢æņĢł ļ¬©ļæÉ ņĪ░Ļ▒┤ņŚÉ ļ¦×ņØä Ļ▓ĮņÜ░ņŚÉļŖö 2ņĢł ņżæ 1ņĢłņØä ņ×äņØśņĀüņ£╝ļĪ£ ĒāØĒĢśņŚ¼ 3ĻĄ░ņ£╝ļĪ£ ļéśļłäņŚłļŗż.
ņŖżĒÄÖĒŖĖļ¤╝ņśüņŚŁ ļ╣øĻ░äņäŁļŗ©ņĖĄņ┤¼ņśüĻ▓Ćņé¼ ļ░Å ļ╣øĻ░äņäŁļŗ©ņĖĄĒśłĻ┤ĆņĪ░ņśüņłĀņØĆ ļ╣øĻ░äņäŁļŗ©ņĖĄņ┤¼ņśüĻĖ░(CirrusŌäó HD-OCT, Carl Zeiss Meditec, Dublin, CA, USA)ļź╝ ņØ┤ņÜ®ĒĢśņŚ¼ ņé░ļÅÖ Ēøä ņ┤¼ņśüĒĢśņśĆļŗż. ņŗĀĒśĖ Ļ░ĢļÅäĻ░Ć ņ┤Ø 10ņĀÉ ņżæ 6ņĀÉ ļ»Ėļ¦īņØ┤Ļ▒░ļéś ļłłņÜ┤ļÅÖ ļō▒ ĒÖśņ×ÉņØś ĒśæņĪ░ļÅäļĪ£ ņØĖĒĢśņŚ¼ ņ┤¼ņśüļÉ£ ņØ┤ļ»Ėņ¦ĆņØś ņ¦łņØ┤ ļ¢©ņ¢┤ņ¦ĆļŖö Ļ▓ĮņÜ░ļŖö ņĀ£ņÖĖĒĢśņśĆļŗż. ļ¬©ļōĀ ņŖżņ║öņØĆ Cirrus OCTA ņåīĒöäĒŖĖņø©ņ¢┤(AngioPlex version 10.0, Carl Zeiss Meditec, Dublin, CA, USA)ļź╝ ņé¼ņÜ®ĒĢśņŚ¼ ļČäņäØļÉśņŚłļŗż.
ļ╣øĻ░äņäŁļŗ©ņĖĄņ┤¼ņśüĻ▓Ćņé¼ņØś Ļ▓ĮņÜ░ ņåīĒöäĒŖĖņø©ņ¢┤ņŚÉņä£ ņ×ÉļÅÖņĀüņ£╝ļĪ£ ņĖĪņĀĢļÉ£ ņŗ£ņŗĀĻ▓Įņ£ĀļæÉĒĢ©ļ¬░ļ╣ä ļ░Å ņŗ£ņŗĀĻ▓Įņ£ĀļæÉņŻ╝ļ│ĆļČĆņØś ĒÅēĻĘĀ, ņāüņĖĪ, ĒĢśņĖĪ, ļ╣äņĖĪ, ņØ┤ņĖĪ ļ¦Øļ¦ēņŗĀĻ▓Įņä¼ņ£ĀņĖĄ ļæÉĻ╗śļź╝ ļČäņäØĒĢśņśĆļŗż. ļ¦Øļ¦ēļé┤ņĖĄņØś ļæÉĻ╗śļŖö ĒÖ®ļ░śļČĆ ņŗĀĻ▓ĮņĀłņäĖĒżņĖĄĻ│╝ ļé┤ļ¦ØņāüņĖĄņØś ļæÉĻ╗śļź╝ ĒĢ®ĒĢ£ ņŗĀĻ▓ĮņĀłņäĖĒż-ļé┤ļ¦ØņāüņĖĄ(ganglion cell-inner plexiform layer, GCIPL)ņ£╝ļĪ£ ĒÅēĻ░ĆĒĢśņśĆĻ│Ā, ĒÅēĻĘĀ ņŗĀĻ▓ĮņĀłņäĖĒż-ļé┤ļ¦ØņāüņĖĄņØś ļæÉĻ╗ś, ņĄ£ņåī ņŗĀĻ▓ĮņĀłņäĖĒż-ļé┤ļ¦ØņāüņĖĄņØś ļæÉĻ╗ś, ņāüņĖĪ, ņāüļ╣äņĖĪ, ņāüņØ┤ņĖĪ, ĒĢśņĖĪ, ĒĢśļ╣äņĖĪ, ĒĢśņØ┤ņĖĪ ņ┤Ø 6ļ░®Ē¢źņØś ņŗĀĻ▓ĮņĀłņäĖĒż-ļé┤ļ¦ØņāüņĖĄņØś ļæÉĻ╗śļź╝ ņĖĪņĀĢĒĢśņŚ¼ ļ╣äĻĄÉĒĢśņśĆļŗż.
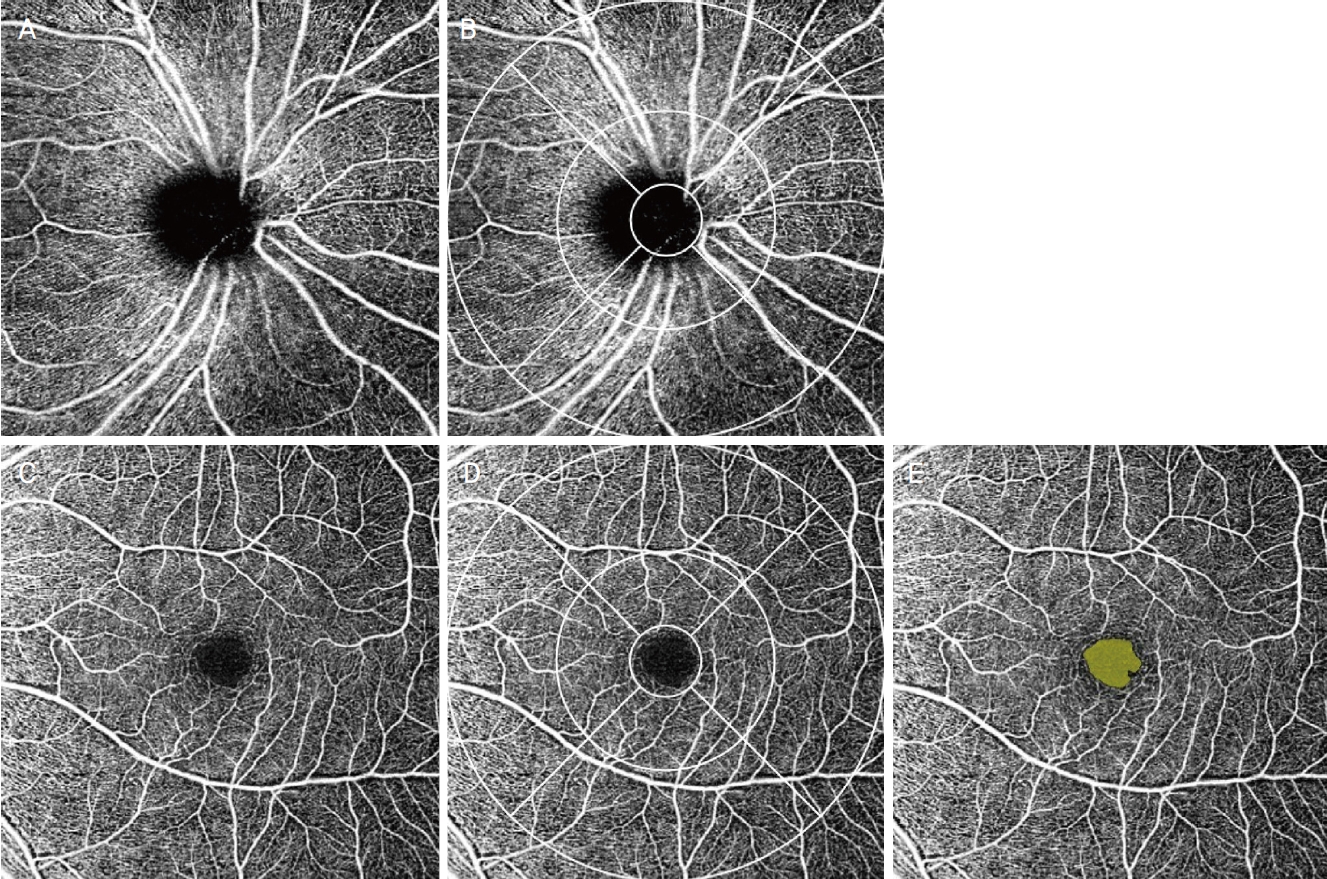
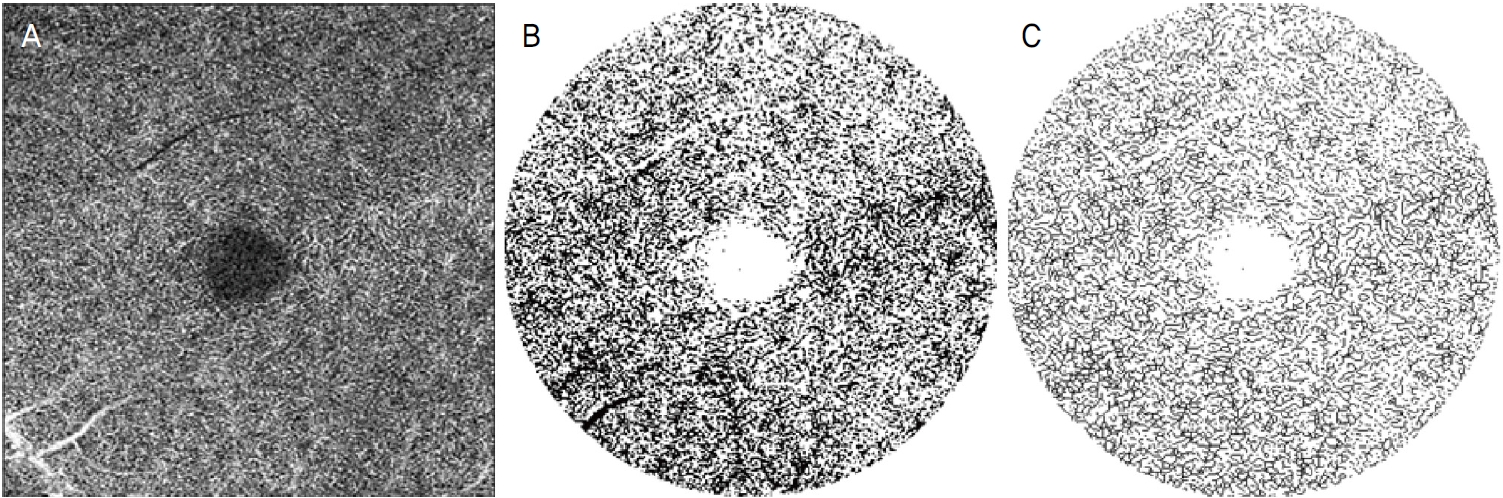
ļ╣øĻ░äņäŁļŗ©ņĖĄĒśłĻ┤ĆņĪ░ņśüņłĀņØś Ļ▓ĮņÜ░, ļé┤ņןļÉ£ ņåīĒöäĒŖĖņø©ņ¢┤ņŚÉņä£ ņĀ£Ļ│ĄļÉśļŖö early treatment diabetic retinopathy study (ETDRS) ņśüņŚŁņØä ņĀüņÜ®ĒĢśņŚ¼ 6 ├Ś 6 mm ņŖżņ║ö ņśüņŚŁņØä ņŗ£ņŗĀĻ▓Įņ£ĀļæÉņØś ļĖīļŻ©Ēü¼ļ¦ē Ļ░£ļ░®(Bruch membrane opening) ņżæņŗ¼Ļ│╝ ĒÖ®ļ░śņśżļ¬®ņØś ņżæņŗ¼ņ£╝ļĪ£ļČĆĒä░ ļ░śĻ▓Į 0.5 mm ņØ┤ļé┤ņØś ņżæņŗ¼ ņśüņŚŁ(center), ļ░śĻ▓Į 0.5-1.5 mm ļ▓öņ£äņØś Ļ│Āļ”¼ ļ¬©ņ¢æ ļé┤ņĖĪ ņśüņŚŁ(inner), ļ░śĻ▓Į 1.5-3.0 mm ļ▓öņ£äņØś Ļ│Āļ”¼ ļ¬©ņ¢æ ņÖĖņĖĪ ņśüņŚŁ(outer), ļ░śĻ▓Į 3 mm ņØ┤ļé┤ņØś ņĀäņ▓┤ ņśüņŚŁ(total)ņ£╝ļĪ£ ļéśļłäĻ│Ā, ļé┤ņĖĪĻ│╝ ņÖĖņĖĪ ņśüņŚŁņØś Ļ▓ĮņÜ░ ĒĢ£ ļ▓ł ļŹö ņāüņĖĪ, ņØ┤ņĖĪ, ļ╣äņĖĪ, ĒĢśņĖĪņ£╝ļĪ£ ļéśļłäņ¢┤ Ļ░üĻ░üņØś Ēæ£ņĖĄļ¬©ņäĖĒśłĻ┤Ćņ┤Ø(superficial capillary plexus, SCP)ņØś ĒśłĻ┤Ćļ░ĆļÅäņÖĆ Ļ┤Ćļźśļ░ĆļÅäļź╝ ņĖĪņĀĢĒĢśņśĆņ£╝ļ®░, ĒÖ®ļ░śļČĆ FAZņØś ļ®┤ņĀüĻ│╝ ļæśļĀłļź╝ ĒÖĢņØĖĒĢśņśĆļŗż(Fig. 1). ļśÉĒĢ£, ņØ┤ņĀä ņŚ░ĻĄ¼ļź╝ ņ░ĖĻ│ĀĒĢśņŚ¼ ļé┤ņןļÉ£ ņåīĒöäĒŖĖņø©ņ¢┤ņŚÉņä£ ņĀ£Ļ│ĄļÉśļŖö Ēł¼ņé¼ ĒÜ©Ļ│╝(projection artifact) ņĀ£Ļ▒░ļź╝ ņŗ£Ē¢ēĒĢ£ ĒÖ®ļ░śļČĆņØś ņŗ¼ņĖĄļ¬©ņäĖĒśłĻ┤Ćņ┤Ø(deep capillary plexus, DCP)ņØś ņŖżņ║ö ņØ┤ļ»Ėņ¦Ćļź╝ Image J (National Institutes of Health, Bethesda, MD, USA)ļź╝ ņØ┤ņÜ®ĒĢśņŚ¼ ļČäņäØ, ĒśłĻ┤Ćļ░ĆļÅä ļ░Å Ļ┤Ćļźśļ░ĆļÅäļź╝ ņĖĪņĀĢĒĢśņśĆļŗż(Fig. 2) [9,10].
ĒåĄĻ│äņĀü ļČäņäØņØĆ Statistic package for social science version 22.0 program (IBM Corp., Armonk, NY, USA)ņØä ņØ┤ņÜ®ĒĢśņŚ¼ ļ¬©ļōĀ Ļ▓ĆņĀĢņŚÉņä£ ņ£ĀņØśņłśņżĆ 0.05 ļ»Ėļ¦īņØĖ Ļ▓ĮņÜ░ļź╝ ĒåĄĻ│äĒĢÖņĀü ņØśņØśĻ░Ć ņ׳ļŖö Ļ▓āņ£╝ļĪ£ ĒīÉņĀĢĒĢśņśĆļŗż. ļŗ©ņĢł ņĀĢņāüņĢłņĢĢļģ╣ļé┤ņן ĒÖśņ×ÉņÖĆ ņĀĢņāü ļīĆņĪ░ĻĄ░ņŚÉ ņåŹĒĢ£ ļīĆņāüņ×ÉņØś ļ▓öņŻ╝ĒśĢ ņ×ÉļŻīļŖö chi ņĀ£Ļ│▒ Ļ▓ĆņĀĢņØä ņé¼ņÜ®ĒĢśņŚ¼ ļ╣äĻĄÉĒĢśņśĆļŗż. ļŗ©ņĢł ņĀĢņāüņĢłņĢĢļģ╣ļé┤ņן ĒÖśņ×ÉņŚÉņä£ ļŗ©ņĢłņŚÉļ¦ī ļ░▒ļé┤ņןņłśņłĀņØä ņŗ£Ē¢ēĒĢśņśĆļŹś Ļ▓ĮņÜ░Ļ░Ć ņŚåņ¢┤, ļ░▒ļé┤ņןņłśņłĀņØś Ļ│╝Ļ▒░ļĀźņØĆ ļŗ©ņĢł ņĀĢņāüņĢłņĢĢļģ╣ļé┤ņן ĒÖśņ×ÉņÖĆ ņĀĢņāü ļīĆņĪ░ĻĄ░ņŚÉ ņåŹĒĢ£ ļīĆņāüņ×É Ļ░äņØś Ļ▓ĮņÜ░ļ¦ī ļČäņäØĒĢśņśĆļŗż. ņłśņ╣śĒśĢ ņ×ÉļŻī ļ░Å ļ╣øĻ░äņäŁļŗ©ņĖĄņ┤¼ņśüĻ▓Ćņé¼ ļ░Å ļ╣øĻ░äņäŁļŗ©ņĖĄĒśłĻ┤ĆņĪ░ņśüņłĀņØä ĒåĄĒĢśņŚ¼ ĻĄ¼ĒĢ£ ņĖĪņĀĢņ╣śļŖö ļ¬©ļōĀ ĻĄ░ņŚÉ ļīĆĒĢśņŚ¼ Kruskal-Wallis Ļ▓ĆņĀĢņØä ĒåĄĒĢśņŚ¼ ļ╣äĻĄÉĒĢśņśĆņ£╝ļ®░, Kruskal-Wallis Ļ▓ĆņĀĢņŚÉņä£ ņ£ĀņØśĒĢ£ Ļ▓ĮņÜ░ Bonferroni ņé¼ĒøäĻ▓ĆņĀĢņØä ņØ┤ņÜ®ĒĢśņŚ¼ ņØ┤ĒÖśņĢłĻĄ░Ļ│╝ ņĀĢņāüņĢłĻĄ░, ļ░śļīĆņĢłĻĄ░Ļ│╝ ņĀĢņāüņĢłĻĄ░ņØä ļ╣äĻĄÉĒĢśņśĆĻ│Ā, ņØ┤ĒÖśņĢłĻĄ░Ļ│╝ ļ░śļīĆņĢłĻĄ░ ļ╣äĻĄÉ ņŗ£ Wilcoxon signed rank Ļ▓ĆņĀĢņØä ņŗ£Ē¢ēĒĢśņśĆļŗż. ļŗ©, ņŚ░ļĀ╣ņØś Ļ▓ĮņÜ░ņŚÉļŖö ļŗ©ņĢł ņĀĢņāüņĢłņĢĢļģ╣ļé┤ņן ĒÖśņ×ÉņÖĆ ņĀĢņāü ļīĆņĪ░ĻĄ░ņŚÉ ņåŹĒĢ£ ļīĆņāüņ×É Ļ░äņØś Ļ▓ĮņÜ░ņŚÉ ļīĆĒĢśņŚ¼ Mann-Whitney U test Ļ▓ĆņĀĢņØä ņŗ£Ē¢ēĒĢśņśĆļŗż. ļ│Ė ņŚ░ĻĄ¼ļŖö ĒŚ¼ņŗ▒ĒéżņäĀņ¢ĖņŚÉ ņ×ģĻ░üĒĢ£ ņØśĒĢÖ ņŚ░ĻĄ¼ ņ£żļ”¼ņŗ¼ņØśņ£äņøÉĒÜīņØś ņŖ╣ņØĖ ņĢäļל ņ¦äĒ¢ēļÉśņŚłņ£╝ļ®░, ļ│Ė ņŚ░ĻĄ¼ņÖĆ Ļ┤ĆļĀ©ļÉ£ ņØ┤ĒĢ┤Ļ┤ĆĻ│äņØś ņāüņČ®ņØĆ ņŚåļŗż(ņŖ╣ņØĖ ļ▓łĒśĖ: 2021-03-014).
Ļ▓░ Ļ│╝
ĒÖśņ×ÉĻĄ░ 24ļ¬ģ ņżæ ļé©ņä▒ņØ┤ 11ļ¬ģ, ņŚ¼ņä▒ņØ┤ 13ļ¬ģņØ┤ļ®░ ĒÅēĻĘĀ ņŚ░ļĀ╣ņØĆ 51.83 ┬▒ 14.20ņäĖ, ņĀĢņāü ļīĆņĪ░ĻĄ░ 29ļ¬ģ ņżæ ļé©ņä▒ņØ┤ 13ļ¬ģ, ņŚ¼ņä▒ņØ┤ 16ļ¬ģņØ┤ļ®░, ĒÅēĻĘĀ ņŚ░ļĀ╣ņØĆ 52.90 ┬▒ 13.68ņäĖņśĆļŗż. ļéśņØ┤, ņä▒ļ│ä, ĻĄ┤ņĀłļźĀ, ņĄ£ļīĆĻĄÉņĀĢņŗ£ļĀź, ĒÅēĻĘĀ ņĢłņĢĢ, ļŗ╣ļć©, Ļ│ĀĒśłņĢĢņØś ņ£Āļ│æļźĀņØĆ ļŗ©ņĢł ņĀĢņāüņĢłņĢĢļģ╣ļé┤ņן ĒÖśņ×ÉņÖĆ ņĀĢņāü ļīĆņĪ░ĻĄ░ņŚÉ ņåŹĒĢ£ ļīĆņāüņ×É Ļ░äņØś ņ░©ņØ┤ļź╝ ļ│┤ņØ┤ņ¦Ć ņĢŖņĢśļŗż(Table 1).
ļ╣øĻ░äņäŁļŗ©ņĖĄņ┤¼ņśüĻ▓Ćņé¼ļź╝ ĒåĄĒĢśņŚ¼ ĻĄ¼ĒĢ£ ņŗ£ņŗĀĻ▓Įņ£ĀļæÉĒĢ©ļ¬░ļ╣äļź╝ ļ╣äĻĄÉĒĢśņśĆņØä ļĢīņŚÉļŖö ņØ┤ĒÖśņĢłĻĄ░ņŚÉņä£ ļ░śļīĆņĢłĻĄ░ņŚÉ ļ╣äĒĢśņŚ¼ ĒåĄĻ│äņĀüņ£╝ļĪ£ ņ£ĀņØśĒĢśĻ▓ī ņ”ØĻ░ĆļÉśņ¢┤ ņ׳ņŚłļŗż(p=0.020). ļ¦Øļ¦ēņŗĀĻ▓Įņä¼ņ£ĀņĖĄ ļæÉĻ╗śļź╝ ļČäņäØĒĢśņśĆņØä ļĢīņŚÉļŖö ņØ┤ĒÖśņĢłĻĄ░ņŚÉņä£ ļ░śļīĆņĢłĻĄ░ņŚÉ ļ╣äĒĢśņŚ¼ ĒÅēĻĘĀ, ņāüņĖĪ, ĒĢśņĖĪ ļ¦Øļ¦ēņŗĀĻ▓Įņä¼ņ£ĀņĖĄ ļæÉĻ╗śņØś Ļ░Éņåīļź╝ ļ│┤ņśĆņ£╝ļ®░(Ļ░üĻ░ü p<0.001, p=0.007, p<0.001), ļ░śļīĆņĢłĻĄ░Ļ│╝ ļīĆņĪ░ĻĄ░ Ļ░äņØś ņ░©ņØ┤ļŖö ņŚåņŚłļŗż(Table 2).
ņŗĀĻ▓ĮņĀłņäĖĒż-ļé┤ļ¦ØņāüņĖĄņØś ļæÉĻ╗śļź╝ ļ╣äĻĄÉĒĢśņśĆņØä ļĢīļŖö ĒÅēĻĘĀ ņŗĀĻ▓ĮņĀłņäĖĒż-ļé┤ļ¦ØņāüņĖĄņØś ļæÉĻ╗ś ļ░Å ņāüņĖĪ, ņāüņØ┤ņĖĪ, ĒĢśļ╣äņĖĪ, ĒĢśņĖĪ, ĒĢśņØ┤ņĖĪ ņŗĀĻ▓ĮņĀłņäĖĒż-ļé┤ļ¦ØņāüņĖĄņØś ļæÉĻ╗ś ļ¬©ļæÉ ņØ┤ĒÖśņĢłĻĄ░ņŚÉņä£ ļ░śļīĆņĢłĻĄ░ ļ░Å ņĀĢņāü ļīĆņĪ░ĻĄ░ņŚÉ ļ╣äĒĢśņŚ¼ ĒåĄĻ│äņĀüņ£╝ļĪ£ ņ£ĀņØśĒĢśĻ▓ī Ļ░ÉņåīļÉśņ¢┤ ņ׳ņŚłņ£╝ļ®░(Ļ░üĻ░ü p<0.001, p=0.022, p=0.008, p<0.001, p<0.001, p<0.001), ņāüļ╣äņĖĪ ņŗĀĻ▓ĮņĀłņäĖĒż-ļé┤ļ¦ØņāüņĖĄņØś ļæÉĻ╗śņØś Ļ▓ĮņÜ░ ņØ┤ĒÖśņĢłĻĄ░ņŚÉņä£ ļ░śļīĆņĢłĻĄ░ņŚÉ ļ╣äĒĢśņŚ¼ ĒåĄĻ│äņĀüņ£╝ļĪ£ ņ£ĀņØśĒĢśĻ▓ī Ļ░ÉņåīļÉśņ¢┤ ņ׳ņŚłļŗż(p=0.030). ĒÅēĻĘĀ ļ░Å ļ¬©ļōĀ ņśüņŚŁņŚÉņä£ ļ░śļīĆņĢłĻĄ░Ļ│╝ ņĀĢņāü ļīĆņĪ░ĻĄ░ Ļ░äņØś ņØśļ»Ė ņ׳ļŖö ņ░©ņØ┤ļŖö ļ│┤ņØ┤ņ¦Ć ņĢŖņĢśļŗż(Table 3).
ļ╣øĻ░äņäŁļŗ©ņĖĄĒśłĻ┤ĆņĪ░ņśüņłĀĻ▓Ćņé¼ņŚÉņä£ ņŗ£ņŗĀĻ▓Įņ£ĀļæÉ ņŻ╝ļ│ĆļČĆņØś Ēæ£ņĖĄļ¬©ņäĖĒśłĻ┤Ćņ┤ØņØś Ēśłļźś Ļ┤ĆļĀ© ņłśņ╣śļź╝ ļ╣äĻĄÉĒĢśņśĆņØä ļĢī, ļŗ©ņĢł ņĀĢņāüņĢłņĢĢļģ╣ļé┤ņןņØ┤ ņ׳ļŖö ĒÖśņ×ÉņØś ņØ┤ĒÖśņĢłĻĄ░ņŚÉņä£ ļ░śļīĆņĢłĻĄ░ ļ░Å ņĀĢņāü ļīĆņĪ░ĻĄ░ļ│┤ļŗż ņĀäņ▓┤, ļé┤ņĖĪ ĒÅēĻĘĀ, ļé┤ņĖĪ ņżæ ĒĢśņĖĪ, ņÖĖņĖĪ ĒÅēĻĘĀ, ņÖĖņĖĪ ņżæ ĒĢśņĖĪ ņśüņŚŁņØś ĒśłĻ┤Ćļ░ĆļÅäņØś Ļ░Éņåī(Ļ░üĻ░ü p=0.014, p=0.011, p<0.001, p=0.010, p<0.001) ļ░Å ņĀäņ▓┤, ļé┤ņĖĪ ĒÅēĻĘĀ, ļé┤ņĖĪ ņżæ ĒĢśņĖĪ, ņÖĖņĖĪ ņżæ ĒĢśņĖĪ ņśüņŚŁņØś Ļ┤Ćļźśļ░ĆļÅäņØś Ļ░Éņåī(Ļ░üĻ░ü p=0.017, p=0.023, p<0.001, p=0.001)ļź╝ ļ│┤ņśĆļŗż. ļśÉĒĢ£, ņØ┤ĒÖśņĢłĻĄ░ņŚÉņä£ ņĀĢņāü ļīĆņĪ░ĻĄ░ļ│┤ļŗż ņÖĖņĖĪ ņśüņŚŁ ĒÅēĻĘĀņØś Ļ┤Ćļźśļ░ĆļÅäņØś Ļ░Éņåī(p=0.003)ļź╝ ļ│┤ņśĆļŗż(Table 4).
ļ╣øĻ░äņäŁļŗ©ņĖĄĒśłĻ┤ĆņĪ░ņśüņłĀĻ▓Ćņé¼ņŚÉņä£ ĒÖ®ļ░śļČĆņØś Ēæ£ņĖĄļ¬©ņäĖĒśłĻ┤Ćņ┤ØņØś Ēśłļźś Ļ┤ĆļĀ© ņłśņ╣śļź╝ ļ╣äĻĄÉĒĢśņśĆņØä ļĢī, ļŗ©ņĢł ņĀĢņāüņĢłņĢĢļģ╣ļé┤ņןņØ┤ ņ׳ļŖö ĒÖśņ×ÉņØś ņØ┤ĒÖśņĢłĻĄ░ņŚÉņä£ ļ░śļīĆņĢłĻĄ░ ļ░Å ņĀĢņāü ļīĆņĪ░ĻĄ░ļ│┤ļŗż ņÖĖņĖĪ ņżæ ĒĢśņĖĪ ņśüņŚŁņØś ĒśłĻ┤Ćļ░ĆļÅä Ļ░Éņåī(p<0.001) ļ░Å ļé┤ņĖĪ ņżæ ĒĢśņĖĪ, ņÖĖņĖĪ ĒÅēĻĘĀ, ņÖĖņĖĪ ņżæ ĒĢśņĖĪ ņśüņŚŁņØś Ļ┤Ćļźśļ░ĆļÅäņØś Ļ░Éņåī(Ļ░üĻ░ü p<0.001, p=0.001, p<0.001)ļź╝ ļ│┤ņśĆņ£╝ļ®░, ņØ┤ĒÖśņĢłĻĄ░ņŚÉņä£ ņĀĢņāü ļīĆņĪ░ĻĄ░ļ│┤ļŗż ņĀäņ▓┤, ņÖĖņĖĪ ņśüņŚŁ ĒÅēĻĘĀ ĒśłĻ┤Ćļ░ĆļÅäņØś Ļ░Éņåī(p=0.006, p=0.041) ļ░Å ņĀäņ▓┤, ņÖĖņĖĪ ņżæ ņØ┤ņĖĪ ņśüņŚŁ Ļ┤Ćļźśļ░ĆļÅäņØś Ļ░Éņåī(p=0.013, p=0.003)ļź╝ ļ│┤ņśĆļŗż(Fig. 3). ļśÉĒĢ£ ņØ┤ĒÖśņĢłĻĄ░ ļ░Å ļ░śļīĆņĢłĻĄ░ņŚÉņä£ ņĀĢņāü ļīĆņĪ░ĻĄ░ļ│┤ļŗż ļé┤ņĖĪ ņżæ ĒĢśņĖĪ ņśüņŚŁņØś ĒśłĻ┤Ćļ░ĆļÅä Ļ░Éņåī(p=0.008) ļ░Å ļé┤ņĖĪ ņżæ ĒĢśņĖĪ ņśüņŚŁ ļ░Å ņÖĖņĖĪ ņśüņŚŁ ĒÅēĻĘĀņØś Ļ┤Ćļźśļ░ĆļÅäņØś Ļ░Éņåī(p<0.001, p=0.001)ļź╝ ļ│┤ņśĆļŗż. ņżæņŗ¼ņśżļ¬®ļ¼┤ĒśłĻ┤ĆļČĆņ£äņØś ļäōņØ┤ņÖĆ ļæśļĀłļŖö ņØ┤ĒÖśņĢłĻĄ░ ļ░Å ļ░śļīĆņĢłĻĄ░ ņé¼ņØ┤, ļ░śļīĆņĢłĻĄ░ ļ░Å ņĀĢņāü ļīĆņĪ░ĻĄ░ ņé¼ņØ┤ņØś ņ¢æ Ļ▓ĮņÜ░ ļ¬©ļæÉņŚÉņä£ ĒåĄĻ│äĒĢÖņĀüņ£╝ļĪ£ ņ£ĀņØśĒĢ£ ņ░©ņØ┤ļź╝ ļ│┤ņØ┤ņ¦Ć ņĢŖņĢśļŗż(Table 5). ļ╣øĻ░äņäŁļŗ©ņĖĄĒśłĻ┤ĆņĪ░ņśüņłĀĻ▓Ćņé¼ņŚÉņä£ ĒÖ®ļ░śļČĆņØś ņŗ¼ņĖĄļ¬©ņäĖĒśłĻ┤Ćņ┤ØņØś Ēśłļźś Ļ┤ĆļĀ© ņłśņ╣śļź╝ ļ╣äĻĄÉĒĢśņśĆņØä ļĢī, ļŗ©ņĢł ņĀĢņāüņĢłņĢĢļģ╣ļé┤ņןņØ┤ ņ׳ļŖö ĒÖśņ×ÉņØś ņØ┤ĒÖśņĢłĻĄ░Ļ│╝ ļ░śļīĆņĢłĻĄ░ ļ░Å ļ░śļīĆņĢłĻĄ░Ļ│╝ ņĀĢņāü ļīĆņĪ░ĻĄ░ Ļ░äņŚÉņä£ ĒśłĻ┤Ćļ░ĆļÅä ļ░Å Ļ┤Ćļźśļ░ĆļÅäņØś ņ£ĀņØśĒĢ£ ņ░©ņØ┤ļź╝ ļ│┤ņØ┤ņ¦Ć ņĢŖņĢśļŗż(Table 6).
Ļ│Ā ņ░░
ļ│Ė ņŚ░ĻĄ¼ņŚÉņä£ ņĀĢņāüņĢłņĢĢļģ╣ļé┤ņןņØś ņØ┤ĒÖśņĢłĻĄ░ņØĆ ļ░śļīĆņĢłĻĄ░ņŚÉ ļ╣äĒĢ┤ ņŗ£ņŗĀĻ▓Įņ£ĀļæÉ ņŻ╝ļ│ĆļČĆ ņĀäņ▓┤, ļé┤ņĖĪ ĒÅēĻĘĀ, ļé┤ņĖĪ ņżæ ĒĢśņĖĪ, ņÖĖņĖĪ ņżæ ĒĢśņĖĪ ņśüņŚŁņØś ĒśłĻ┤Ćļ░ĆļÅäņÖĆ Ļ┤Ćļźśļ░ĆļÅä Ļ░Éņåī, ĒÖ®ļ░śļČĆ ņÖĖņĖĪ ņżæ ĒĢśņĖĪ ņśüņŚŁņØś ĒśłĻ┤Ćļ░ĆļÅä ļ░Å Ļ┤Ćļźśļ░ĆļÅä Ļ░Éņåīļź╝ ļ│┤ņśĆĻ│Ā, ņĀĢņāü ļīĆņĪ░ĻĄ░ņŚÉ ļ╣äĒĢ┤ ņŗ£ņŗĀĻ▓Įņ£ĀļæÉ ņŻ╝ļ│ĆļČĆ ņĀäņ▓┤, ļé┤ņĖĪ ĒÅēĻĘĀ, ļé┤ņĖĪ ņżæ ĒĢśņĖĪ, ņÖĖņĖĪ ĒÅēĻĘĀ, ņÖĖņĖĪ ņżæ ĒĢśņĖĪ ņśüņŚŁņØś ĒśłĻ┤Ćļ░ĆļÅäņÖĆ Ļ┤Ćļźśļ░ĆļÅä Ļ░Éņåī ļ░Å ĒÖ®ļ░śļČĆ ņĀäņ▓┤, ļé┤ņĖĪ ņżæ ĒĢśņĖĪ, ņÖĖņĖĪ ĒÅēĻĘĀ, ņÖĖņĖĪ ņżæ ĒĢśņĖĪ ņśüņŚŁņØś ĒśłĻ┤Ćļ░ĆļÅäņÖĆ Ļ┤Ćļźśļ░ĆļÅä Ļ░Éņåīļź╝ ļ│┤ņśĆļŗż. ļ╣øĻ░äņäŁļŗ©ņĖĄĒśłĻ┤ĆņĪ░ņśüņłĀņØä ĒåĄĒĢśņŚ¼ ņŗ£ņŗĀĻ▓Įņ£ĀļæÉņÖĆ ĒÖ®ļ░śļČĆņØś Ēæ£ņĖĄļ¬©ņäĖĒśłĻ┤Ćņ┤ØņØä ņāüņĖĪ, ĒĢśņĖĪ, ļ╣äņĖĪ, ņØ┤ņĖĪņ£╝ļĪ£ ļéśļłäņ¢┤ ņØ┤ĒÖśņĢłĻ│╝ ļ░śļīĆņĢł, ņØ┤ĒÖśņĢłĻ│╝ ņĀĢņāüņĢłņØä Ļ░üĻ░ü ļ╣äĻĄÉĒĢĀ ņŗ£ ņŻ╝ļĪ£ ĒĢśņĖĪņØś ņśüņŚŁņŚÉņä£ ĒśłĻ┤Ćļ░ĆļÅä ļ░Å Ļ┤Ćļźśļ░ĆļÅäņØś Ļ░Éņåīļź╝ ļ│┤ņśĆņ£╝ļ®░, ņØ┤ļŖö ņĀĢņāüņĢłņĢĢļģ╣ļé┤ņןņŚÉņä£ ņøÉļ░£Ļ░£ļ░®Ļ░üļģ╣ļé┤ņןņŚÉ ļ╣äĒĢ┤ ĒĢśņĖĪĻ│╝ ĒĢśņØ┤ņĖĪ ņŗ£ņŗĀĻ▓Įņ£ĀļæÉĒģī ļæÉĻ╗śņØś ņ£ĀņØśĒĢ£ Ļ░Éņåīļź╝ ļ│┤ņśĆļŗżļŖö ņŚ░ĻĄ¼ Ļ▓░Ļ│╝ļōżĻ│╝[11,12] ĒĢśņĖĪ ņŗ£ņŗĀĻ▓ĮĒģīņØś ļäłļ╣äĻ░Ć ņ¢ćņØĆ ņŗ£ņŗĀĻ▓ĮņŚÉņä£ ņĀĢņāüņĢłņĢĢļģ╣ļé┤ņןņØś ļ░£ņāØ ņ£äĒŚśņØ┤ ņ”ØĻ░ĆĒĢ£ļŗżļŖö ņØ┤ņĀäņØś ņŚ░ĻĄ¼ Ļ▓░Ļ│╝ļōżĻ│╝ ļ╣äņŖĘĒĢ£ ņ¢æņāüņØä ļ│┤ņØĖļŗż[13,14].
ņĀĢņāüņĢłņĢĢļģ╣ļé┤ņןņŚÉņä£ ņĢłņĢĢņāüņŖ╣ņØ┤ Ļ┤Ćņ░░ļÉśņ¦Ć ņĢŖņØīņŚÉļÅä ļČłĻĄ¼ĒĢśĻ│Ā, Collaborative Normal Tension Glaucoma Study (CNTGS)ņŚÉņä£ ņĀĢņāüņĢłņĢĢļģ╣ļé┤ņןņŚÉņä£ņØś ņĢłņĢĢĒĢśĻ░ĢņØś ņØ┤ņĀÉņØä ļ░ØĒśĆļéĖ ņØ┤ļל[15], Ēśäņ×¼ ņĀĢņāüņĢłņĢĢļģ╣ļé┤ņןņØś ņ╣śļŻīļŖö ņøÉļ░£Ļ░£ļ░®Ļ░üļģ╣ļé┤ņןĻ│╝ ņ£Āņé¼ĒĢśĻ▓ī ņØ╝ņ░©ņĀüņ£╝ļĪ£ ņĢłņĢĢĒĢśĻ░ĢņØä ļ¬®Ēæ£ļĪ£ ĒĢśĻ│Ā ņ׳ļŗż. ĒĢśņ¦Ćļ¦ī ņĢ×ņä£ ĻĖ░ņłĀĒĢśņśĆļō»ņØ┤, ņĀĢņāüņĢłņĢĢļģ╣ļé┤ņןņŚÉņä£ ņĢłņĢĢ ņØ┤ņÖĖņØś ņØĖņ×ÉļĪ£ ņØĖĒĢ£ ņøÉņØĖņØ┤ ņ׳ņØä ņłś ņ׳ņ£╝ļ»ĆļĪ£ ņØ┤ļōżņŚÉ ļīĆĒĢ£ ņ╣śļŻīņØś ņżæņÜöņä▒ņØ┤ ļČĆĻ░üļÉśĻ│Ā ņ׳ļŗż. Low-Pressure Glaucoma Treatment Study (LoGTS)ļŖö ņĀĢņāüņĢłņĢĢļģ╣ļé┤ņןņØś ņ╣śļŻīņŚÉ ņ׳ņ¢┤ ņŗĀĻ▓Į ļ│┤ĒśĖ ĒÜ©Ļ│╝ņÖĆ Ļ░ÖņØĆ ņĢłņĢĢĻ│╝ ļÅģļ”ĮņĀüņØĖ ņÜöņåīņØś ņżæņÜöņä▒ņŚÉ ļīĆĒĢśņŚ¼ ļ░ØĒ×ī ļ░ö ņ׳ļŗż[16]. ļ│Ė ņŚ░ĻĄ¼ņŚÉņä£ļÅä ņĀĢņāüņĢłņĢĢļģ╣ļé┤ņןņØś ņØ┤ĒÖśņĢłĻĄ░ņŚÉņä£ ļ░śļīĆņĢłĻĄ░ ļ░Å ņĀĢņāü ļīĆņĪ░ĻĄ░ļ│┤ļŗż ļ¦Øļ¦ēĒśłļźś Ļ┤ĆļĀ© ņ¦ĆĒæ£Ļ░Ć Ļ░ÉņåīļÉśņŚłņ£╝ļ»ĆļĪ£ ņĀĢņāüņĢłņĢĢļģ╣ļé┤ņןņØś ņ¦äļŗ© ļ░Å ņ╣śļŻīņŚÉ ņ׳ņ¢┤ ĒśłļźśņÖĆ Ļ┤ĆļĀ©ļÉ£ ņÜöņåīņŚÉ ļīĆĒĢ£ Ļ│ĀļĀżĻ░Ć ĒĢäņÜöĒĢĀ Ļ▓āņ£╝ļĪ£ ņé¼ļŻīļÉ£ļŗż.
ņØ┤ņĀä ļ╣øĻ░äņäŁļŗ©ņĖĄĒśłĻ┤ĆņĪ░ņśüņłĀņØä ņØ┤ņÜ®ĒĢ£ ņĀĢņāüņĢłņĢĢļģ╣ļé┤ņןņŚÉ ļīĆĒĢ£ ņŚ░ĻĄ¼ņŚÉņä£, ņĀĢņāüņĢłņĢĢļģ╣ļé┤ņן ņØ┤ĒÖśņĢłņŚÉņä£ ņĀĢņāü ļīĆņĪ░ĻĄ░ņŚÉ ļ╣äĒĢśņŚ¼ ņŗ£ņŗĀĻ▓Įņ£ĀļæÉ ļ╣äņĖĪņØä ņĀ£ņÖĖĒĢ£ ņśüņŚŁņØś ļ¦Øļ¦ēņŗĀĻ▓Įņä¼ņ£ĀņĖĄņ£╝ļĪ£ņØś ļ¦Øļ¦ēĒśłļźśņÖĆ ņŗ£ņŗĀĻ▓Įņ£ĀļæÉ ņŻ╝ļ│Ć ņĀäņ▓┤ ņśüņŚŁņØś ļ¬©ņäĖĒśłĻ┤Ć ļ░ĆļÅäņØś ņĀĆĒĢśĻ░Ć Ļ┤Ćņ░░ļÉśņŚłņ£╝ļ®░, ņØ┤ļŖö ļ╣øĻ░äņäŁļŗ©ņĖĄņ┤¼ņśü ļ░Å ņŗ£ņĢ╝Ļ▓Ćņé¼ņØś Ļ▓░Ļ│╝ņÖĆļÅä ņØ╝ņ╣śĒĢśļŖö ņåīĻ▓¼ņØä ļ│┤ņśĆļŗż[17]. ļŗżļźĖ ņŚ░ĻĄ¼ņŚÉņä£ļÅä ņĀĢņāüņĢłņĢĢļģ╣ļé┤ņן ņØ┤ĒÖśņĢłņŚÉņä£ ņĀĢņāü ļīĆņĪ░ĻĄ░ņŚÉ ļ╣äĒĢśņŚ¼ ņŗ£ņŗĀĻ▓Įņ£ĀļæÉ ņŻ╝ļ│ĆļČĆ Ēæ£ņĖĄļ¬©ņäĖĒśłĻ┤Ćņ┤ØņØś ĒśłĻ┤Ćļ░ĆļÅäņØś Ļ░ÉņåīĻ░Ć Ļ┤Ćņ░░ļÉ©ņØä ļ│┤ņśĆļŗż[18]. ļ│Ė ņŚ░ĻĄ¼ņŚÉņä£ļÅä ņØ┤ņĀä ņŚ░ĻĄ¼ Ļ▓░Ļ│╝ņÖĆ ļ╣äņŖĘĒĢśĻ▓ī Ēæ£ņĖĄļ¬©ņäĖĒśłĻ┤Ćņ┤ØņØś ĒśłļźśņØĖņ×ÉņØś Ļ░ÉņåīĻ░Ć ļŗ©ņĢł ņĀĢņāüņĢłņĢĢļģ╣ļé┤ņן ĒÖśņ×ÉņØś ņØ┤ĒÖśņĢłņŚÉņä£ ļéśĒāĆļé©ņØä Ļ┤Ćņ░░ĒĢśņśĆļŗż.
ļ│Ė ņŚ░ĻĄ¼ņŚÉņä£ ļŗ©ņĢł ņĀĢņāüņĢłņĢĢļģ╣ļé┤ņן ļ░śļīĆņĢłņŚÉņä£ ļ¦Øļ¦ēņŗĀĻ▓Įņä¼ņ£ĀņĖĄ ļ░Å ļ¦Øļ¦ēņŗĀĻ▓ĮņĀłņäĖĒżņØś ņåÉņāüņØĆ Ļ┤Ćņ░░ļÉśņ¦Ć ņĢŖņĢśĻ│Ā ļ╣øĻ░äņäŁļŗ©ņĖĄņ┤¼ņśüĻ▓Ćņé¼ņŚÉņä£ ņĀĢņāüņĢłņĢĢļģ╣ļé┤ņןņØś ļ░śļīĆņĢłĻĄ░Ļ│╝ ņĀĢņāü ļīĆņĪ░ĻĄ░ Ļ░äņØś ļ¦Øļ¦ēņŗĀĻ▓Įņä¼ņ£ĀņĖĄ ļ░Å ņŗĀĻ▓ĮņĀłņäĖĒż-ļé┤ļ¦ØņāüņĖĄņØś ļæÉĻ╗śņØś ņ░©ņØ┤ļŖö ļ│┤ņØ┤ņ¦Ć ņĢŖņĢśņ£╝ļ»ĆļĪ£ ĻĄ¼ņĪ░ņĀüņ£╝ļĪ£ ņĀĢņāü ļīĆņĪ░ĻĄ░Ļ│╝ ņ░©ņØ┤Ļ░Ć ņŚåļŗżĻ│Ā ļ│╝ ņłś ņ׳ļŗż. ļ╣øĻ░äņäŁļŗ©ņĖĄĒśłĻ┤ĆņĪ░ņśüņłĀņØä ņØ┤ņÜ®ĒĢśņŚ¼ Ēæ£ņĖĄļ¬©ņäĖĒśłĻ┤Ćņ┤ØņØä ļ╣äĻĄÉĒĢśļ®┤, ņĀĢņāüņĢłņĢĢļģ╣ļé┤ņןņØś ļ░śļīĆņĢł ĻĄ░ņØĆ ļīĆņĪ░ĻĄ░ņŚÉ ļ╣äĒĢ┤ ņŗ£ņŗĀĻ▓Įņ£ĀļæÉ ņŻ╝ļ│ĆļČĆņØś ĒśłĻ┤Ćļ░ĆļÅä ļ░Å Ļ┤Ćļźśļ░ĆļÅäņØś ņ░©ņØ┤ļŖö ņŚåņŚłņ£╝ļ®░, ĒÖ®ļ░śļČĆņØś ļé┤ņĖĪ ņżæ ĒĢśņĖĪ ņśüņŚŁņØś ĒśłĻ┤Ćļ░ĆļÅäņÖĆ Ļ┤Ćļźśļ░ĆļÅä Ļ░Éņåī, ņÖĖņĖĪ ņśüņŚŁ ĒÅēĻĘĀņØś Ļ┤Ćļźśļ░ĆļÅä Ļ░Éņåīļź╝ ļ│┤ņśĆļŗż. ņØ┤ļŖö ņŗ£ņŗĀĻ▓Įņ£ĀļæÉņØś ļ¬©ņäĖĒśłĻ┤Ćļ¦ØņØĆ ĒśłĻ┤ĆĻ│╝ ļČäņ¦ĆļōżņØ┤ ļ░Ćņ¦æļÉśņ¢┤ ņ׳ņ¢┤ Ļ▓Įļ»ĖĒĢ£ ĒŚłĒśłņä▒ ņåÉņāüņØä ĒÅēĻ░ĆĒĢśĻĖ░ ņ¢┤ļĀżņÜĖ ņłś ņ׳Ļ│Ā, ĒÖ®ļ░śļČĆļŖö ļ¦Øļ¦ēļÅÖļ¦źņŚÉ ņØśĒĢ┤ņä£ļ¦ī ĒśłņĢĪ Ļ│ĄĻĖēņØä ļ░øĻ│Ā ļŗżļźĖ ņĪ░ņ¦üņŚÉ ļ╣äĒĢ┤ ņé░ņåīņåīļ╣äļ¤ēņØ┤ ļåÆņĢä ļ╣äĻĄÉņĀü ĒŚłĒśłņä▒ ņåÉņāüņŚÉ ņĘ©ņĢĮĒĢ£ ĒŖ╣ņä▒ņØ┤ ņśüĒ¢źņØä ņŻ╝ņŚłņØä Ļ▓āņ£╝ļĪ£ ņāØĻ░üĒĢ┤ ļ│╝ ņłś ņ׳Ļ▓Āļŗż[19,20]. ņØ┤ļ¤¼ĒĢ£ ļ│ĆĒÖöĻ░Ć ņĀĢņāüņĢłņĢĢļģ╣ļé┤ņן ļ░£ņāØĻ│╝ Ļ┤ĆļĀ©ņØ┤ ņ׳ļŖöņ¦ĆņŚÉ Ļ┤ĆĒĢ┤ņä£ ņČöĻ░ĆņĀüņØĖ ņŚ░ĻĄ¼Ļ░Ć ĒĢäņÜöĒĢĀ Ļ▓āņ£╝ļĪ£ ņāØĻ░üļÉ£ļŗż.
ļŗ©ņĢł ļģ╣ļé┤ņןņØś ļ░śļīĆņĢłĻ│╝ ņĀĢņāü ļīĆņĪ░ĻĄ░ņØä ļ╣äĻĄÉĒĢ£ ņŚ░ĻĄ¼ļōżņØä ņé┤ĒÄ┤ļ│┤ļ®┤, ļŗ©ņĢł ņŗ£ņĢ╝ņĀäļŗ©Ļ│ä ļģ╣ļé┤ņןņŚÉņä£ ļ╣øĻ░äņäŁļŗ©ņĖĄĒśłĻ┤ĆņĪ░ņśüņłĀņØä ĒåĄĒĢśņŚ¼ ņŗ£ņŗĀĻ▓Įņ£ĀļæÉ ņŻ╝ļ│ĆļČĆ ļ¬©ņäĖĒśłĻ┤ĆņØś ĒśłĻ┤Ćļ░ĆļÅäļź╝ ļ╣äĻĄÉĒĢśņśĆņØä ļĢī, ļŗ©ņĢł ņŗ£ņĢ╝ņĀäļŗ©Ļ│ä ļģ╣ļé┤ņן ņØ┤ĒÖśņĢłĻĄ░ņØĆ ļ░śļīĆņĢłĻĄ░Ļ│╝ ļīĆņĪ░ĻĄ░ņŚÉ ļ╣äĒĢ┤ ņŗ£ņŗĀĻ▓Įņ£ĀļæÉ ņŻ╝ļ│ĆļČĆņØś ĒśłĻ┤Ćļ░ĆļÅäņØś Ļ░Éņåīļź╝ ļ│┤ņśĆņ£╝ļéś, ļ░śļīĆņĢłĻĄ░Ļ│╝ ņĀĢņāü ļīĆņĪ░ĻĄ░ Ļ░äņØś ņŗ£ņŗĀĻ▓Įņ£ĀļæÉ ņŻ╝ļ│ĆļČĆņØś ĒśłĻ┤Ćļ░ĆļÅäņØś ņ£ĀņØśĒĢ£ ņ░©ņØ┤ļź╝ ļ│┤ņØ┤ņ¦Ć ņĢŖņĢśļŗż. ņØ┤ļŖö ļ│Ė ņŚ░ĻĄ¼ņÖĆ ņØ╝ņ╣śĒĢśļŖö Ļ▓░Ļ│╝ļź╝ ļ│┤ņśĆņ¦Ćļ¦ī ĒĢ┤ļŗ╣ ņŚ░ĻĄ¼ņŚÉņä£ ļģ╣ļé┤ņן ņØ┤ĒÖśņĢłņØś ņ╣śļŻī ņĀä ĒÅēĻĘĀ ņĢłņĢĢņØĆ 23.0 ┬▒ 1.8 mmHgņśĆņ£╝ļ®░, ņØ┤ĒÖśņĢłĻ│╝ ļ░śļīĆņĢłņØś ņĢłņĢĢņØś ļ╣äļīĆņ╣ŁņØä ņŚ░ĻĄ¼ ļīĆņāüņØś ĒżĒĢ© ĻĖ░ņżĆņØś ĒĢśļéśļĪ£ ĒĢśņśĆĻĖ░ ļĢīļ¼ĖņŚÉ ļŗ©ņĢł ņĀĢņāüņĢłņĢĢļģ╣ļé┤ņןņØ┤ ņĢäļŗī ņøÉļ░£Ļ░£ļ░®Ļ░üļģ╣ļé┤ņןņØä ĒżĒĢ©ĒĢ£ Ļ▓░Ļ│╝ņØĖ ņĀÉņØä Ļ│ĀļĀżĒĢśņŚ¼ņĢ╝ ĒĢ£ļŗż[21]. ļŗ©ņĢł ņĀĢņāüņĢłņĢĢļģ╣ļé┤ņן ĒÖśņ×ÉņØś ņØ┤ĒÖśņĢłĻĄ░ ļ░Å ļ░śļīĆņĢłĻĄ░Ļ│╝ ņĀĢņāü ļīĆņĪ░ĻĄ░ņØä ļ╣äĻĄÉĒĢ£ ņŚ░ĻĄ¼ņŚÉņä£ļŖö ļģ╣ļé┤ņן ņØ┤ĒÖśņĢłĻĄ░ņØĆ ļ░śļīĆņĢłĻĄ░Ļ│╝ ļīĆņĪ░ĻĄ░ņŚÉ ļ╣äĒĢ┤ ņŗ£ņŗĀĻ▓Įņ£ĀļæÉ ņŻ╝ļ│ĆļČĆņØś ĒśłĻ┤Ćļ░ĆļÅäņØś Ļ░Éņåīļź╝ ļ│┤ņśĆņ£╝ļéś, ļ░śļīĆņĢłĻĄ░Ļ│╝ ņĀĢņāü ļīĆņĪ░ĻĄ░ Ļ░äņØś ņŗ£ņŗĀĻ▓Įņ£ĀļæÉ ņŻ╝ļ│ĆļČĆņØś ĒśłĻ┤Ćļ░ĆļÅäņØś ņ£ĀņØśĒĢ£ ņ░©ņØ┤ļź╝ ļ│┤ņØ┤ņ¦Ć ņĢŖņĢśņ£╝ļ®░ ņØ┤ļŖö ļ│Ė ņŚ░ĻĄ¼ņÖĆ ņØ╝ņ╣śĒĢśļŖö Ļ▓░Ļ│╝ļź╝ ļ│┤ņśĆļŗż[22]. ĒĢśņ¦Ćļ¦ī ĒÖ®ļ░śļČĆņØś ļČäņäØņØä ņŗ£Ē¢ēĒĢśņ¦Ć ņĢŖņĢä ļ│Ė ņŚ░ĻĄ¼ņØś ĒÖ®ļ░śļČĆ Ļ▓░Ļ│╝ņÖĆļŖö ļ╣äĻĄÉĒĢĀ ņłś ņŚåņŚłļŗż.
ņŗ¼ņĖĄļ¬©ņäĖĒśłĻ┤Ćņ┤ØņØś Ļ▓ĮņÜ░, ņØ┤ņĀä ņŚ░ĻĄ¼ņŚÉņä£ ņĀĢņāüņĢłņĢĢļģ╣ļé┤ņן ņØ┤ĒÖśņĢłĻ│╝ ņĀĢņāü ļīĆņĪ░ĻĄ░ Ļ░äņŚÉ Ļ┤Ćļźśļ░ĆļÅä ļ░Å ĒśłĻ┤Ćļ░ĆļÅäņØś ņ░©ņØ┤ļź╝ ļ│┤ņØ┤ņ¦Ć ņĢŖņĢśĻ│Ā[22], ņØ┤ļŖö ļ│Ė ņŚ░ĻĄ¼ņØś Ļ▓░Ļ│╝ņÖĆ ņØ╝ņ╣śĒĢśļŖö ņ¢æņāüņØä ļ│┤ņśĆļŗż. ļ░śļīĆņĢłņØś Ļ▓ĮņÜ░ņŚÉļÅä ņĀĢņāü ļīĆņĪ░ĻĄ░ Ļ░äņŚÉ Ļ┤Ćļźśļ░ĆļÅä ļ░Å ĒśłĻ┤Ćļ░ĆļÅäņØś ņ░©ņØ┤ļź╝ ļ│┤ņØ┤ņ¦Ć ņĢŖņĢśļŗż. ņØ┤ļŖö Ēæ£ņĖĄļ¬©ņäĖĒśłĻ┤Ćņ┤ØņØś Ļ▓ĮņÜ░ ĒĢśļéśņØś ņäĖļÅÖļ¦ź ļ░Å ņäĖņĀĢļ¦ź ņé¼ņØ┤ņŚÉ ņŚ░Ļ▓░ļÉśņ¢┤ ņ׳ņ£╝ļéś ņŗ¼ņĖĄļ¬©ņäĖĒśłĻ┤Ćņ┤ØņØś Ļ▓ĮņÜ░ ĒĢśļéśņØś ņäĖļÅÖļ¦ź ļ░Å ņäĖņĀĢļ¦ź ņé¼ņØ┤ņŚÉ ņŚ░Ļ▓░ļÉśņ¢┤ ņ׳ļŖö ļÅÖņŗ£ņŚÉ ļŗżļźĖ ņŗ¼ņĖĄļ¬©ņäĖĒśłĻ┤Ćņ┤Ø Ļ░äņØś ļ¼ĖĒĢ®ņØ┤ ĒśĢņä▒ļÉśņ¢┤ ņ׳ņ¢┤ ļŗżļźĖ ņäĖļÅÖļ¦ź ļ░Å ņäĖņĀĢļ¦źĻ│╝ļÅä ņŚ░Ļ▓░ļÉśļŖö ĒŖ╣ņä▒ ļĢīļ¼Ėņ£╝ļĪ£ ņāØĻ░üĒĢ┤ ļ│╝ ņłś ņ׳ņ£╝ļéś[23], ņČöĻ░ĆņĀüņØĖ ņŚ░ĻĄ¼Ļ░Ć ļŹö ĒĢäņÜöĒĢĀ Ļ▓āņØ┤ļØ╝ ņāØĻ░üĒĢ£ļŗż.
ļ│Ė ņŚ░ĻĄ¼ņŚÉņä£ 3ņ░© ņāüĻĖēņóģĒĢ®ņØśļŻīĻĖ░Ļ┤ĆņŚÉ ļé┤ņøÉĒĢśņŚ¼ ļŗ©ņĢł ņĀĢņāüņĢłņĢĢļģ╣ļé┤ņןņ£╝ļĪ£ ņ¦äļŗ© ļ░øņØĆ ĒÖśņ×ÉņÖĆ Ļ▓Ćņ¦ä ļ¬®ņĀüņ£╝ļĪ£ ļģ╣ļé┤ņן Ļ▓Ćņé¼ļź╝ ņŗ£Ē¢ē ļ░øņØĆ Ļ▓ĮņÜ░ļź╝ ļīĆņāüņ£╝ļĪ£ ĒĢśņśĆĻ│Ā, ļīĆņāüņ×ÉņØś ņłśĻ░Ć ņāüļīĆņĀüņ£╝ļĪ£ ņĀüņ¢┤ ņØ┤ļĪ£ ņØĖĒĢ£ ļ╣äļÜżļ”╝ņØś Ļ░ĆļŖźņä▒ņØ┤ ņ׳ļŗż. ļśÉĒĢ£ ņĀĢņāüņĢłņĢĢļģ╣ļé┤ņן ņ¦äļŗ© ļŗ╣ņŗ£ ņŗ£Ē¢ēĒĢ£ ļ╣øĻ░äņäŁļŗ©ņĖĄņ┤¼ņśü ļ░Å ļ╣øĻ░äņäŁļŗ©ņĖĄĒśłĻ┤ĆņĪ░ņśüņłĀļĪ£ ņĖĪņĀĢĒĢ£ ņłśņ╣śļź╝ ļŗ©ļ®┤ņĀüņ£╝ļĪ£ ļČäņäØĒĢśņśĆņ£╝ļ®░ Ē¢źĒøä ņČöĻ░Ć ņŚ░ĻĄ¼ļź╝ ĒåĄĒĢśņŚ¼ ņŗ£Ļ░äņŚÉ ļö░ļźĖ ņĀĢņāüņĢłņĢĢļģ╣ļé┤ņןņØś ļ░£ļ│æ ņ£Āļ¼┤ ļ░Å Ļ▓ĮĻ│╝ņØś ļ│ĆĒÖöļź╝ ĒÖĢņØĖĒĢ┤ ļ│┤ļŖö Ļ▓āņØ┤ ĒĢäņÜöĒĢĀ Ļ▓āņ£╝ļĪ£ ņé¼ļŻīļÉ£ļŗż. ļ¦łņ¦Ćļ¦ēņ£╝ļĪ£ Ļ░ü ĻĄ░ Ļ░äņØś ļ╣äĻĄÉ ņŗ£ ĒåĄĻ│äņĀüņ£╝ļĪ£ ņ£ĀņØśĒĢ£ ņ░©ņØ┤ļź╝ ļ│┤ņØĖ ņśüņŚŁņŚÉņä£ļŖö ĒśłĻ┤Ćļ░ĆļÅä ļ░Å Ļ┤Ćļźśļ░ĆļÅäĻ░Ć Ļ░ÖņØ┤ Ļ░ÉņåīĒĢśņśĆņ£╝ļéś ņĀĢņāüņĢłņĢĢļģ╣ļé┤ņןņØś ņØ┤ĒÖśņĢłņØä ļ░śļīĆņĢł ļ╣äĻĄÉ ņŗ£ ņŗ£ņŗĀĻ▓Įņ£ĀļæÉ ņŻ╝ļ│ĆļČĆ ņÖĖņĖĪ ĒÅēĻĘĀ ĒśłĻ┤Ćļ░ĆļÅä, ļīĆņĪ░ĻĄ░Ļ│╝ ļ╣äĻĄÉ ņŗ£ ĒÖ®ļ░śļČĆ ņØ┤ņĖĪ ņśüņŚŁņØś Ļ┤Ćļźśļ░ĆļÅä, ņĀĢņāüņĢłņĢĢļģ╣ļé┤ņןņØś ļ░śļīĆņĢłĻĄ░Ļ│╝ ļīĆņĪ░ĻĄ░ ļ╣äĻĄÉ ņŗ£ ĒÖ®ļ░śļČĆ ņÖĖņĖĪ ņśüņŚŁ ĒÅēĻĘĀņØś Ļ┤Ćļźśļ░ĆļÅäĻ░Ć ņ░©ņØ┤ļź╝ ļ│┤ņśĆņ£╝ļ®░ ņØ┤ļŖö ņØ╝ņĀĢĒĢ£ Ļ▓ĮĒ¢źņØä ļ│┤ņØ┤ņ¦Ć ņĢŖĻ│Ā ņé░ļ░£ņĀüņ£╝ļĪ£ ļéśĒāĆļé¼ņ£╝ļ»ĆļĪ£ ĒĢ┤ņäØ ņŗ£ ņŻ╝ņØśĒĢ┤ņĢ╝ ĒĢśĻ▓Āļŗż.
Ļ▓░ļĪĀņĀüņ£╝ļĪ£ ļ│Ė ņŚ░ĻĄ¼ņŚÉņä£ ņĀĢņāüņĢłņĢĢļģ╣ļé┤ņן ĒÖśņ×ÉļōżņØś ņØ┤ĒÖśņĢłĻĄ░ņŚÉņä£ ļ░śļīĆņĢł ļ░Å ņĀĢņāü ļīĆņĪ░ĻĄ░ņŚÉ ļ╣äĒĢ┤ ņŗ£ņŗĀĻ▓Įņ£ĀļæÉ ņŻ╝ļ│ĆļČĆ ļ░Å ĒÖ®ļ░śļČĆ Ēæ£ņĖĄļ¬©ņäĖĒśłĻ┤Ćņ┤ØņØś Ļ┤Ćļźśļ░ĆļÅäņÖĆ ĒśłĻ┤Ćļ░ĆļÅäĻ░Ć Ļ░ÉņåīļÉ©ņØä ļ│┤ņśĆļŗż. ļśÉĒĢ£ ņĀĢņāüņĢłņĢĢļģ╣ļé┤ņן ļ░śļīĆņĢłĻĄ░ņØĆ ņĀĢņāü ļīĆņĪ░ĻĄ░ņŚÉ ļ╣äĒĢśņŚ¼ ĒÖ®ļ░śļČĆ ļé┤ņĖĪ ņĢäļלņ¬Į ņśüņŚŁņØś Ēæ£ņĖĄļ¬©ņäĖĒśłĻ┤Ćņ┤ØņØś ĒśłĻ┤Ćļ░ĆļÅä ļ░Å Ļ┤Ćļźśļ░ĆļÅäņØś Ļ░Éņåīļź╝ ļ│┤ņśĆļŗż. ļö░ļØ╝ņä£ ļŗ©ņĢł ņĀĢņāüņĢłņĢĢļģ╣ļé┤ņן ĒÖśņ×ÉņŚÉņä£ļÅä ņČöĒøä ļ░śļīĆņĢłņŚÉ ļģ╣ļé┤ņןņØ┤ ļ░£ņāØĒĢśļŖö ņ¦ĆņŚÉ Ļ┤ĆĒĢ£ ņŻ╝ņØśĻ╣ŖņØĆ Ļ┤Ćņ░░ņØ┤ ĒĢäņÜöĒĢĀ Ļ▓āņ£╝ļĪ£ ņāØĻ░üļÉśļ®░, ņĀĢņāüņĢłņĢĢļģ╣ļé┤ņןņØś ņ¦äļŗ© ļ░Å ņ╣śļŻīņŚÉ ņ׳ņ¢┤ņä£ļÅä ļ¦Øļ¦ēĒśłļźśņÖĆ Ļ┤ĆļĀ©ļÉ£ ņÜöņØĖņŚÉ ļīĆĒĢ£ Ļ│ĀļĀżĻ░Ć ĒĢäņÜöĒĢĀ Ļ▓āņ£╝ļĪ£ ļ│┤ņØĖļŗż.


 PDF Links
 PubReader
 ePub Link
 Full text via DOI
 Download Citation
 Print
Print