

 Address reprint requests to In Young Chung, MD, PhD Department of Ophthalmology, Gyeongsang National University Hospital, #79 Gangnam-ro, Jinju 52727, Korea
 망막정맥폐쇄는 당뇨망막병증 다음으로 두 번째로 흔한 망막혈관질환이다[1]. 망막정맥폐쇄는 폐쇄 부위에 따라 망막분지정맥폐쇄, 망막중심정맥폐쇄, 절반망막중심정맥폐쇄로 분류되며 망막분지정맥폐쇄는 망막중심정맥폐쇄에 비해 4배 발생 빈도가 높은 것으로 알려져 있다[2]. 황반부종은 망막분지정맥폐쇄에서 시력감소를 일으키는 가장 중요한 원인으로, 혈관폐쇄의 결과로 발생한 허혈은 혈액망막장벽의 파괴 및 혈관내피성장인자, interleukin (IL)-6, IL-8, IL-12, IL-13 등의 염증인자를 유발하여 혈관 투과성을 증가시켜 손상된 모세혈관 내피세포 틈으로 체액과 혈장 성분이 축적되어 이차적으로 황반부종이 발생하게 된다[3-5].
시력감소를 보이는 황반부종에 대한 치료 방법으로 초기에는 Branch Vein Occlusion Study [6]와 Standard Care vs. Corticosteroid for Retinal Vein Occlusion Study [7]의 발표 이후 격자레이저광응고술이 황반부종의 주된 치료였다. 또한 유리체내 스테로이드주입술을 시행해 볼 수 있으나 백내장, 안압상승과 같은 합병증이 발생할 수 있어 사용하는 데 제약이 있었다[8-10]. 하지만 유리체내 항혈관내피성장인자 주사치료 도입 후 여러 연구들에서 중심망막두께 감소와 시력호전을 보고하였고 Ranibizumab for Branch Retinal Vein Occlusion Study [11]와 VIBRANT study [12]에서 격자레이저광응고술보다 더 좋은 시력호전을 보여주고 있으며 현재 최근에는 유리체내 항혈관내피성장인자 주입술이 망막분지정맥폐쇄의 황반부종에 대한 일차치료로 많이 시행되고 있다[13-15].
유리체내 항혈관내피성장인자 주입술은 주사 후 대부분 호전 상태를 유지하기 위해 재주사치료를 필요로 하고, 베바시주맙(Avastin®, Genentech Inc., Oceanside, CA, USA; The Roche Group, Basel, Switzerland)은 비용적 측면을 고려할 때 상대적으로 저렴하여 망막정맥폐쇄에 동반되는 황반부종에 널리 사용되는 약제이다[16]. 하지만 아직까지 유리체내 베바시주맙주입술 최적의 스케줄 방법에 대하여 결정된 바는 없다. 이에 본 연구에서는 망막분지정맥폐쇄로 인한 황반부종에 대한 치료로서 유리체내 베바시주맙주입술을 초기 한 달 간격으로 3회 시행 이후 부종 재발 시 추가적으로 주사를 시행한 군과 초기 3회 로딩 치료를 하지 않은 군을 비교하여 시력 및 중심황반두께를 분석하였고, 기능적 호전과 해부학적 호전에 영향을 미치는 예측 인자에 대하여 알아보고자 하였다.
대상과 방법
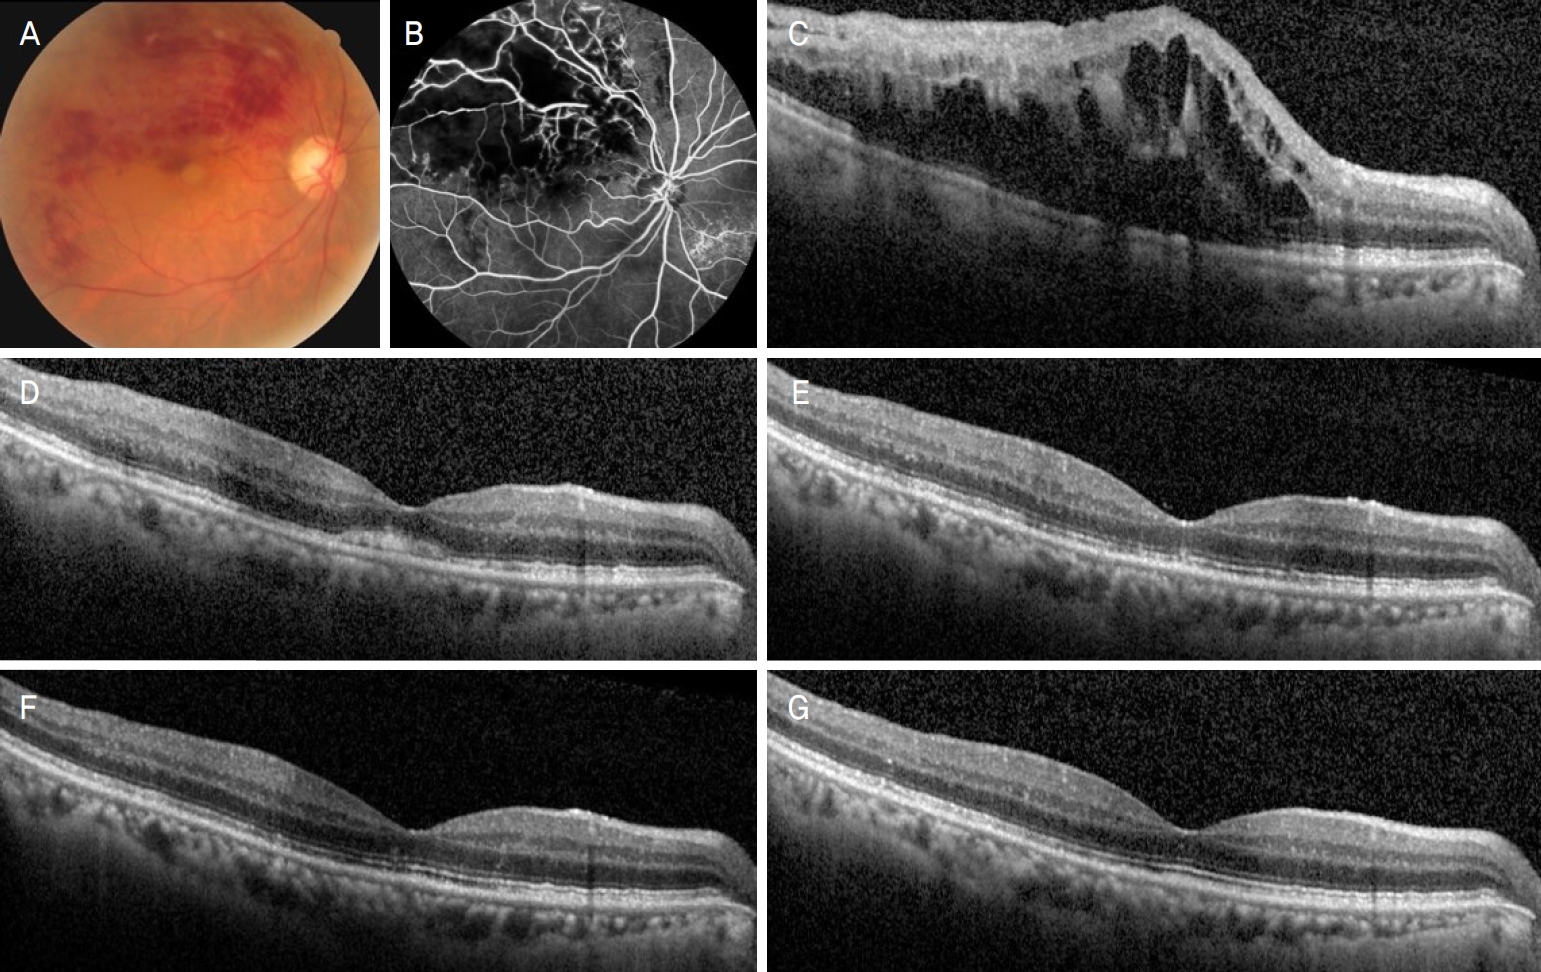
본 연구는 2016년 11월부터 2019년 10월까지 망막분지정맥폐쇄에 동반된 황반부종으로 진단받고 유리체내 베바시주맙주입술을 시행받은 환자에서 연구 기준에 적합한 62명 62안을 대상으로 의무기록을 후향적으로 분석하였으며 헬싱키선언에 입각한 생명의학연구윤리 심사위원회의 승인하에 진행되었다(승인 번호: 2021-03-016). 환자들은 유리체내 베바시주맙주입술 스케줄 방법에 따라 두 군으로 분류되었다. 황반부종에 대하여 초기 한 달 간격으로 3회 로딩 치료에 성공한 21안과 그렇지 않은 그룹 41안의 두 군으로 분류하였다. 초기 한 달 간격으로 3회 주입 이후 필요 시에 추가적으로 주입한 군은 3 monthly군으로 정의하였고, 3회 로딩으로 치료하지 않은 군은 non-3 monthly군으로 정의하였다(Fig. 1). 연구에 포함된 환자는 망막분지정맥폐쇄로 진단되고 진단 당시 최대교정시력 20/40-20/320, 빛간섭단층촬영에서 중심황반두께가 300 μm 이상인 경우, 최초 치료로 유리체내 베바시주맙주입술을 시행받고 12개월 이상 경과 관찰한 환자를 대상으로 하였다. 다음의 경우는 연구 대상에서 제외하였다: 1) 이전에 망막분지정맥폐쇄로 유리체내 트리암시놀론 혹은 항혈관내피성장인자 주입술을 받은 경우, 2) 시력에 유의한 영향을 줄 수 있는 각막혼탁, 시축을 침범하는 백내장, 유리체혼탁, 유리체출혈 같은 매체 혼탁이 있는 경우, 3) 안구내 염증이 있었던 경우, 4) 유리체절제술 과거력이 있는 경우, 5) 연령관련황반변성, 당뇨황반부종, 황반원공 등과 같이 황반부 기능에 영향을 미칠 수 있는 다른 질환을 보이는 경우, 5) 최근 6개월 이내 뇌혈관 및 심혈관 질환이 있었던 경우.
대상 환자들은 최대교정시력, 안압, 세극등현미경검사, 안저검사, 빛간섭단층촬영(HRA Spectralis+OCT, Heidelberg Engineering, Heidelberg, Germany), 형광안저혈관조영(HRA2 FAG, Heidelberg engineering Gmbh, Heidelberg, Germany)을 시행하였다. 형광안저혈관조영을 통해 망막의 허혈 정도를 평가하였고 출혈이 많은 급성기를 고려하여 출혈 흡수 경과에 따라 1-4개월 내에 시행되었다. 모세혈관 비관류는 형광안저혈관조영에서 모세혈관계의 탈락이 발견되는 경계에서부터의 면적을 시신경유두 크기를 기준으로 범위를 구분하였으며, 출혈에 의하여 형광안저혈관조영에서 차단 현상으로 모세혈관계의 거짓 탈락이 관찰되는 경우 안저사진과 비교하여 구별하였다. 비관류 범위가 시신경유두의 5배 이상의 크기인 경우 허혈성 망막분지정맥폐쇄(ischemic branch retinal vein occlusion [ischemic BRVO])로 정의하였으며 시신경유두의 5배보다 작은 경우 비허혈성 망막분지정맥폐쇄(non-ischemic BRVO)로 정의하였다[17]. 빛간섭단층촬영을 통해 중심황반두께(central macular thickness), 망막내층손상(disorganization of retinal inner layer), 장액망막박리(serous retinal detachment), 바깥경계막(external limiting membrane) 손상, 빛수용체타원체구역(elipsoid zone) 손상, 맥락막두께를 평가하였다. 중심황반두께는 빛간섭단층촬영 사진을 이용하여 내경계막으로부터 브루크막까지의 거리를 수직으로 측정하였다. 망막내층손상의 정의는 망막중심오목을 중심으로 2,000 μm 범위 내의 신경절세포층, 내망상층복합체, 내핵층과 외망상층 간의 경계가 불명확한 것으로 정의하였다[18]. 맥락막두께는 망막색소상피의 후면부터 맥락막공막 경계부까지의 거리를 망막중심오목 및 망막중심오목으로부터 비측과 이측으로 500 μm 간격으로 총 7군데에서 수직으로 측정한 평균값을 사용하였다[19].
모든 환자들은 0.5% proparacaine hydrochloride (Alcaine®, Alcon, Fort Worth, TX, USA)으로 시술 전 점안마취한 뒤 povidone iodine으로 속눈썹과 눈주위를 소독하고, 개검기를 끼우고 1.25% povidone iodine으로 세척한 뒤 각막윤부에서 하외측 3.0 mm 혹은 3.5 mm 부위의 섬모체 평면부를 통해 30게이지 일회용 바늘을 이용하여 유리체내 베바시주맙(1.25 mg/0.05 mL)을 주입하였다. 시술 후 감염 예방을 위하여 0.5% moxifloxacin hydrochloride (Moroxacin®, Hanmi Pharm., Seoul, Korea)를 1주일간 하루 4회 사용하였다. 재치료는 1) 중심황반두께가 300 μm 이상인 경우, 2) 망막하액이나 망막내액이 새롭게 발병하는 경우에 유리체내 베바시주맙재주입술을 시행하였다.
유리체내 베바시주맙주입술 시행 전과 시술 3개월, 6개월, 9개월, 12개월의 최대교정시력과 빛간섭단층촬영을 이용한 중심황반두께를 측정하여 두 군에서 시술 후의 효과를 비교분석하였다. 최대교정시력은 통계학적 분석을 위해 분석 전 logarithm of the minimum angle of resolution (logMAR) 값으로 환산하여 분석하였다. 통계 분석에는 SPSS 프로그램(SPSS version 21.0, software for windows; IBM Corp., Armonk, NY, USA)을 이용하였다. Kolmogorov-Smirnov test와 Shapiro-Wilk test을 통하여 정규성 검정을 하고 관찰 각 시점에서 두 군 간의 비교는 student’s t-test를 사용하였으며 수술 전후의 비교는 paired t-test로 분석하였다. 해부학적 호전과 기능적 호전과 관련된 예측인자를 알아보기 위해 단변량 회귀분석과 다변량 회귀분석을 시행하였다. p값이 0.05 미만인 경우에 통계적으로 유의한 것으로 정의하였다.
결 과
전체 62명 62안의 환자군 중, non-3 monthly군은 41명 41안으로 평균 나이는 63.18 ± 14.72세였으며, 3 monthly군은 21명 21안으로 평균 나이는 60.25 ± 11.69세였다. 나이, 성별 비율, 당뇨, 고혈압 기저질환, 위수정체안, 허혈성 망막분지정맥폐쇄의 비율에 대하여 두 군 간의 차이는 없었다. 증상 발현부터 치료까지의 기간은 non-3 monthly군에서 25.6 ± 9.25일, 3 monthly군에서 31.58 ± 10.15일로 통계적으로 두 군 간의 유의한 차이는 없었다. 환자들의 치료 전 각 특성들에 대하여 Table 1에 나타내었다. Non-3 monthly 군에서 유리체내 베바시주맙주입술 치료에 반응하지 않은 증례는 베바시주맙과 트리암시놀론 혼합제제로 약제를 전환한 환자가 3안, 라니비주맙으로 약제를 전환한 환자가 4안, 덱사메타손 삽입물로 약제를 전환한 환자가 2안이었고, 3 monthly군에서 유리체내 베바시주맙주입술 치료에 반응하지 않은 증례는 베바시주맙과 트리암시놀론 혼합제제로 약제를 전환한 환자가 2안, 라니비주맙으로 약제를 전환한 환자가 2안이었다.
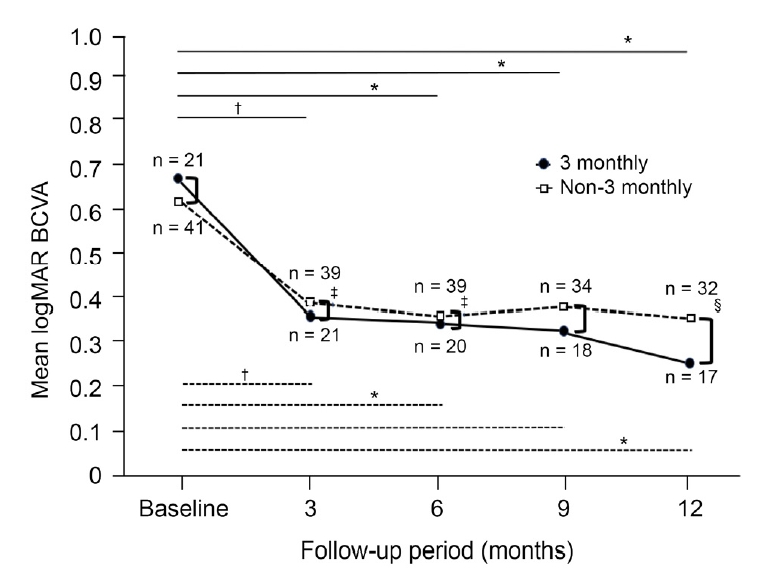
유리체내 주사 치료 전 최대교정시력은 non-3 monthly군에서 0.61 ± 0.29 logMAR, 3 monthly군에서 0.69 ± 0.30 logMAR로 두 군 간의 차이는 없었다. 유리체내 주사 후 최대교정시력이 non-3 monthly군은 시술 3개월, 6개월, 9개월, 12개월에 각각 0.39 ± 0.31, 0.36 ± 0.29, ± 0.38 ± 0.25, 0.36 ± 0.27 logMAR이었으며(p=0.003, p=0.018, p=0.249, p=0.045), 3 monthly군은 시술 3개월, 6개월, 9개월, 12개월에 각각 0.36 ± 0.26, 0.34 ± 0.28, 0.32 ± 0.31, 0.25 ± 0.22 logMAR로(p=0.002, p=0.027, p=0.049, p=0.031) non-3 monthly 군과 3 monthly군 두 군 모두 치료 전과 비교하여 12개월째 유의한 시력개선을 보였다. 두 군을 비교하였을 때 최대 교정시력은 3개월, 6개월, 12개월째 3 monthy군에서 non-3 monthly군보다 더 큰 유의한 시력호전이 있었다(p=0.025, p=0.019, p=0.008) (Fig. 2).
유리체내 주사치료 전 중심황반두께는 non-3 monthly군에서 507.15 ± 145.21 μm, 3 monthly군에서 518.33 ± 156.24 μm로 두 군 간의 차이는 없었다. 유리체내 주사 후 중심황반두께가 non-3 monthly군은 시술 3개월, 6개월, 9개월, 12개월에 각각 268.72 ± 87.41, 248.13 ± 68.22, 261.84 ± 70.42, 281.31 ± 75.23 μm였으며(p=0.007, p=0.013, p=0.028, p=0.034), 3 monthly군은 시술 3개월, 6개월, 9개월, 12개월에 각각 276.31 ± 95.75, 237.35 ± 65.91, 263.43 ± 83.72, 257.14 ± 89.51 μm로(p=0.003, p=0.009, p=0.041, p=0.018) non-3 monthly군과 3 monthly군 두 군 모두에서 치료 전과 비교하여 12개월째 유의한 중심황반두께의 감소를 보였다. 두 군을 비교하였을 때 중심황반두께는 6개월째 3 monthy 군에서 non-3 monthly군보다 더 큰 유의한 중심황반두께 호전을 보였다(p=0.034) (Fig. 3).
기능적 호전과 해부학적 호전에 영향을 미치는 예측인자에 관하여 알아보기 위해 단변량 회귀분석과 다변량 회귀분석을 시행하였다. 기능적 호전에 대하여 시력개선 정도와 최종 시력 결과에 대하여 분석하였다. 시력개선 정도에 대하여 단변량 회귀분석 결과 연령, 증상 발현부터 치료까지의 기간, 3회 로딩, 최대교정시력, 중심황반두께, 망막내층손상, 맥락막두께가 시력호전과 관련된 예측인자로(p=0.009, p=0.035, p=0.039, p=0.002, p=0.021, p=0.038, p=0.027), 다변량 회귀분석 결과 증상 발현부터 치료까지의 기간, 3회 로딩, 최대교정시력, 망막내층손상, 맥락막두께가 시력호전과 관련된 예측인자로 나타났다(p=0.044, p=0.047, p=0.004, p=0.045, p=0.034) (Table 2). 최종 시력에 대하여 단변량 회귀분석 결과 연령, 증상 발현부터 치료까지의 기간, 3회 로딩, 최대교정시력, 망막비관류 정도, 망막내층손상이 최종 시력과 관련된 예측인자로(p=0.039, p=0.046, p=0.037, p=0.006, p=0.034, p=0.032), 다변량 회귀분석 결과 연령, 3회 로딩, 최대교정시력, 망막내층손상이 최종 시력과 관련된 예측인자로 나타났다(p=0.045, p=0.046, p=0.002, p=0.034) (Table 3). 해부학적 호전에 대하여 단변량 회귀분석 결과 증상 발현부터 치료까지의 기간, 망막비관류 정도, 중심황반두께, 망막내층손상, 장액망막박리, 맥락막두께가 중심황반두께 호전과 관련된 예측인자로(p=0.023, p=0.028, p=0.004, p=0.015, p=0.031, p=0.007), 다변량 회귀분석 결과 증상 발현부터 치료까지의 기간, 중심황반두께, 맥락막두께가 중심황반두께 호전과 관련된 예측인자로 나타났다(p=0.042, p=0.009, p=0.015) (Table 4). 1년 시점에서 유리체내 베바시주맙주입술 평균 주사 횟수는 non-3 monthly군에서 3.6 ± 1.7회, 3 monthly군에서 3.9 ± 1.0회였다. 12개월간 유리체내 베바시주맙주입술 시행으로 안내염, 유리체출혈, 뇌경색 및 심근경색의 혈전색전성 질환과 같은 심각한 합병증은 나타나지 않았다.
고 찰
망막분지정맥폐쇄는 동정맥 교차 부위에 혈관이 막혀 망막출혈이 나타나고 황반부종이나 허혈이 발생하여 시력장애를 일으킨다[20]. 허혈로 인한 신경조직 손상으로 세포 내외의 고장성 환경이 형성되어 부종이 발생하고, 정맥의 혈류가 차단되면서 혈관내 압력상승과 황반 미세혈관으로 가는 혈류가 감소되어 혈액망막장벽의 파괴와 혈관투과성을 증가시켜 혈장성분이나 체액이 망막의 외망상층이나 내과립층 등에 누출되어 황반부종이 발생한다[21,22]. 황반부종이 동반된 안구의 방수에서 혈관내피성장인자, 태반성장인자, 혈소판유래성장인자, IL-6, IL-8 등의 염증인자와 같은 사이토카인이 고농도로 축적되며 황반부종에 중요한 역할을 하는 것으로 알려져 있다[23,24]. 이러한 황반부종의 기전에 따라 유리체내 항혈관내피성장인자 주입술 혹은 유리체내 스테로이드 주입술이 치료 방법으로 사용되면서 황반부종의 치료에 많은 발전이 이루어져 왔다. 그러나 스테로이드 주사의 경우 안압상승, 백내장 발생, 안내염 등 합병증 발생 가능성으로[25] 사용 대상에 제약이 있고, 현재 항혈관내피성장인자 주입술이 망막분지정맥폐쇄의 황반부종의 일차적 치료로 사용되고 있다. 망막분지정맥폐쇄성 황반부종에 대한 급여가 허용된 라니비주맙, 애플리버셉트와 같은 약제들의 현재 급여 적용 기준은 1) 반대편 눈이 실명(최대교정시력 0.3 이하의 노동력 상실 실명)인 경우, 2) 반대편 눈의 최대교정시력이 0.4 이상인 경우는 발병 2-3개월이 경과하여도 300 μm 이상의 황반부종이 지속되면서 최대교정시력이 0.5 이하인 경우다. 또한 단안당 총 5회 이내에서만 급여가 적용될 수 있다. 이처럼 증상 발현 기간과 시력 기준에 대한 엄격한 급여 조건의 기준이 있고, 횟수 제한이 있어 유리한 가격 측면과 적극적인 조기치료를 위해 실제 임상에서는 off label 약제인 베바시주맙을 많이 선택하기도 한다.
본 연구에서는 유리체내 베바시주맙을 초기 한 달 간격으로 3회 로딩 치료에 성공한 군과 그렇지 않은 군을 12개월간 관찰하였다. 그 결과 최대교정시력(logMAR)은 non-3 monthly군보다 3 monthly군에서 3개월, 6개월, 12개월째 유의하게 더 큰 호전을 보였다. 하지만 중심황반두께는 3 monthly군에서 non-3 monthly군보다 6개월째 유의하게 더 큰 감소를 보였으나 다른 시점에서는 통계적으로 유의하지 않았다. 본 연구에서는 3 monthly군이 non-3 monthly 군에 비하여 치료 결과에서 기능적 및 해부학적 우위를 보였으나 이와 다르게 초기 3회 주입군과 초기 1회 주입군을 비교한 Miwa et al [26]과 Ito et al [27] 연구에서는 최대교정시력이 두 군 간의 차이가 없었고, 초기 3회 주입군과 pro re nata (PRN) 주입군을 비교한 Ahn et al [28] 연구에서도 최대교정시력과 중심황반두께 변화에 대하여 두 군 간의 차이를 보이지 않았다. 그러나 Miwa et al [26]의 연구에서 기저 최대교정시력이 20/40 이하인 환자들과 20/40을 초과하는 환자들로 나누어 분석한 결과, 초기 최대교정시력이 불량한 경우 12개월의 관찰 기간 동안 초기 3회 주입군에 비하여 초기 1회 주입군의 시력과 중심황반두께가 더 나쁜 경향을 보인 반면, 초기 최대교정시력이 좋은 경우 12개월의 관찰기간 동안 초기 3회 주입군과 초기 1회 주입군의 시력과 중심황반두께가 상대적으로 유사한 경향을 보임을 보고하였다. Miwa et al [26], Ito et al [27]와 Ahn et al [28]의 연구에서는 초기 3회 주입군이 비교군에 비하여 주사 횟수가 많았으며, 본 연구에서는 통계적 의미를 보이지는 않았지만 주사 횟수가 3 monthly군에서 non-3 monthly군에 비하여 조금 더 많았다. 하지만 본 연구는 후향적 연구로 1) 초기 3회 로딩을 하려 하였으나 경과 관찰이 안 된 경우, 2) 환자의 의지에 따라 의사의 지시를 따르지 않아 로딩을 하지 못한 경우에 대하여 엄밀한 의미의 PRN군으로 보기는 어려워 non-3 monthly군으로 구분하여 정의하였고, 이를 참고하여 결과를 해석해야 할 것으로 보인다. 또한 본 연구는 기존 연구들과 비교하여 연구 대상 및 재주사 기준에서 차이점이 있다. Ahn et al [28]의 연구에서는 황반부종이 동반된 망막분지정맥폐쇄의 환자에서 최대교정시력이 20/30 이하인 환자들을 연구 대상으로 하였으나 본 연구에서는 최대교정시력 20/40-20/320의 환자들을 연구 대상에 포함시켰고, Ito et al [27]의 연구와 비교해 볼 때 진단 시 평균 최대교정시력이 본 연구에서 더 낮은 것으로 볼 때 망막분지정맥폐쇄 정도가 심한 환자들이 본 연구에 더 많은 분포를 차지하고 있어 연구 대상인 환자들의 특성에 차이가 있을 것으로 생각된다. 기존 Ahn et al [28]의 연구에서의 허혈성 망막분지정맥폐쇄의 포함 비율의 경우에도 본 연구에서 연구 대상의 더 많은 분포를 차지하고 있는 것으로 보인다. 그리고 기존 연구에서는 마지막 검사보다 빛간섭단층촬영에서 중심황반두께가 100 μm 이상 증가하거나 최대교정시력이 0.1 logMAR 이상 감소하는 경우 또는 중심황반두께가 300 μm 이상이거나 최대교정시력이 20/40 미만인 경우 재주사를 시행하였으나, 본 연구는 후향적 연구로서 기존 연구들과 달리 재주사 시행 기준이 덜 엄격하였던 것도 결과를 해석할 때 고려해야 할 것으로 생각된다. 3 monthly군과 PRN군에 대한 연구 결과는 다양한 이견이 있으며 앞으로 더 많은 연구가 필요할 것으로 생각된다.
본 연구는 또한 황반부종이 동반된 망막분지정맥폐쇄에서 기능적 호전과 해부학적 호전과 관련되는 예측인자를 분석하였다. 다변량 회귀분석 결과 발병 시기부터 치료 시작까지의 기간, 3회 로딩, 치료 전 최대교정시력, 치료 전망막내층손상, 치료 전 맥락막두께가 최대교정시력 호전 정도와 관련있는 유의한 예측인자였고, 연령, 3회 로딩, 치료 전 최대교정시력, 치료 전 망막내층손상이 최종 시력과 관련된 유의한 예측인자였다. 발병 시점부터 치료 시작까지의 기간, 치료 전 중심황반두께, 치료 전 맥락막두께는 중심황반두께 감소 정도와 관련되는 유의한 예측인자였다. Lloyd Clark et al [29]은 망막정맥폐쇄환자에서 초기 최대교정시력이 좋은 경우, 전체 황반 볼륨이 큰 경우, 망막하액이 존재하는 경우 최종적으로 더 빠른 시력호전을 보인다고 보고하였으며 Shin et al [30]은 초기 최대교정시력이 좋은 경우, 빛수용체타원체구역이 보존된 경우 좋은 최종 시력과 유의한 관계가 있다고 하였다. Středová et al [31]은 망막분지정맥폐쇄 환자에서 어린 나이, 짧은 유병 기간, 초기시력이 안 좋을수록 시력호전 정도가 더 큰 치료 효과를 보였다고 보고하였다.
망막내층손상은 빛간섭단층촬영에서 신경절세포층, 내망상층, 내핵층과 외망막상층의 경계가 불명확해진 부위를 의미하며 당뇨망막병증, 망막정맥폐쇄 등 혈관질환에서 시력예후가 불량할 수 있음을 예측할 수 있는 생물학적 지표로 황반부의 모세혈관 비관류 부위와 무혈관 부위의 확립이 망막내층손상과 연관된다고 알려져 있다[32]. Babiuch et al [18]에서는 망막분지정맥폐쇄 환자 중 치료 전 망막내층손상이 있는 군에서 치료 전 최대교정시력이 낮았으며, 유리체내 항혈관내피인자주입술 후 시력호전 정도가 망막내층손상이 있는 군에서 시력호전이 낮음을 보고하였고, 본 연구에서도 망막내층손상이 최대교정시력 호전 정도 뿐 아니라 최종 시력과 관련된 유의한 예측인자로 비등한 결과를 보였다. 또한 Suzuki et al [33]은 망막내층손상과 망막분지정맥폐쇄 환자의 황반부종 재발과 유의한 상관관계가 있음을 발표한 바 있다.
맥락막혈류는 신체에서 단위 면적당 혈류량이 가장 많은 곳으로 망막외층의 정상적인 신진대사를 충족시키기 위해 필요하다. 구조적 및 기능적으로 정상 맥락막혈관 구조는 망막의 기능을 위해 필수적이며, 맥락막 자체가 시력을 위해 매우 중요하다. 상대적으로 두꺼운 기저 맥락막두께를 가진 눈은 황반부종으로부터 회복할 가능성이 증가한다고 볼 수 있다[34-36]. Song et al [37]은 망막분지정맥폐쇄 환자에서 병변이 발생한 부위가 병변이 발생하지 않은 부위에 비해 맥락막의 두께가 더 높게 측정된다고 보고하였으며, 망막저산소증으로 혈관내피세포성장인자의 발현 증가로 안구혈관의 투과성이 높아지면서 저산소 상태의 망막에 인접한 맥락막의 확장과 두꺼워짐을 유발할 수 있다고 발표한 바 있다. Coban-Karatas et al [19]은 망막분지정맥폐쇄가 있는 안에서 정상안에 비하여 맥락막두께가 두꺼웠으며 항혈관내피세포성장인자 주입술 치료 후 맥락막두께가 정상안과 비슷한 두께로 돌아오는 결과를 보고하였으며 이에 대하여 혈관내피세포성장인자의 발현 증가가 맥락막두께의 증가를 유발한다고 설명하고 있다. Rayess et al [38]은 망막분지정맥폐쇄 환자에서 최대교정시력이 2줄 이상 호전된 환자들을 기능적 반응군으로, 그렇지 않았던 환자들을 기능적 비반응군으로 분류하여 분석한 결과, 기능적 반응군의 망막분지정맥폐쇄안에서 맥락막두께는 기능적 반응군의 정상안 뿐 아니라 기능적 비반응군의 망막분지정맥폐쇄안의 맥락막두께 비교에서도 유의하게 높다고 보고하였으며 치료전 맥락막두께가 클수록 항내피세포성장인자 주입술 후 시력호전 정도가 반응이 크다고 보고하였다. 이러한 황반부종이 동반된 망막분지정맥폐쇄에서 맥락막두께가 두꺼울수록 시력호전 정도가 좋은 것은 망막외층으로 관류가 보존될 수 있어 시력호전에 대한 잠재적 가능성이 높아질 수 있다고 생각된다. 또한 맥락막두께가 두꺼울수록 항혈관내피성장인자의 수치가 높기 때문에 항혈관내피성장인자에 대한 반응 또한 높아져서 더 큰 기능적 호전을 보일 수 있다고 생각된다. An et al [39]은 황반부종을 동반한 망막분지정맥폐쇄 환자의 방수에서 혈관내피성장인자 A와 염증성 사이토카인 수치를 측정하여 시력호전 정도 및 중심황반두께 감소 정도와 관련된 요소를 분석하고, 맥락막두께와 염증성 사이토카인의 관계를 조사하였다. 다중회귀분석 결과 방수의 IL-8 농도가 6개월 동안의 시력호전 정도 및 중심황반두께 감소 정도와 유의한 관계가 있음을 보고하였다. 또한 방수의 혈관내피성장인자 A 농도가 기저 맥락막두께 비율(망막분지정맥폐쇄안의 맥락막두께/정상안의 맥락막두께)과 유의한 상관관계가 있음을 발표하였다. 맥락막두께가 두꺼울수록 방수의 수용성 혈관내피성장인자 수용체 2와 IL-8의 농도가 높게 측정되고 얇은 맥락막두께를 가진 군과 비교하여 더 나은 시력호전 정도와 더 큰 중심황반두께의 감소를 보임을 보고하였다. 이저럼 저자들도 망막분지정맥폐쇄에서 두꺼운 기저 맥락막두께는 더 좋은 치료 결과를 예측할 수 있는 인자로 생각되며 이는 환자들의 안 내의 염증성 사이토카인의 높은 농도와 관련성이 있다고 사료된다.
결론적으로 망막분지정맥폐쇄의 황반부종에서 3 monthly 군은 non-3 monthly군에 비하여 단기적인 기능적 및 해부학적 호전과 장기적인 기능적 호전에 치료 우위적 효과를 기대할 수 있었다. 초기 매달 3회 집중적인 치료는 망막의 구조적 이상이 지속되는 기간이 단축되어 비가역적 손상을 줄일 수 있고, 혈액망막장벽의 파괴와 염증반응을 조기에 조절하여 추가적인 손상을 감소시켜 비가역적 저하를 줄이고 최종 시력호전을 높일 수 있다고 생각된다. 하지만 본 연구의 제한점으로 non-3 monthly군 41안에 비하여 3 monthly 군이 21안으로 상대적으로 적었다는 점, 망막분지정맥폐쇄의 정도에 따른 분석을 할 수 없었다는 점, 의무기록을 후향적으로 분석한 연구로 여러 종류의 항혈관내피성장인자약제 선택 및 유리체내 베바시주맙주입술 스케줄 선택과 재치료에 있어서 엄격한 기준을 적용하지 못하였다는 점, 12개월 이상 관찰 가능하였던 환자들을 대상으로 하였기에 이에 대한 선택 바이어스(selection bias)가 작용하였을 가능성이 있어 이를 염두에 두고 결과를 해석해야 할 것이다. 추후 더 많은 환자군을 포함하고 12개월 이상의 장기적인 관찰과 연구가 시행된다면 황반부종이 동반된 망막분지정맥폐쇄 환자의 치료에 도움이 될 수 있을 것으로 생각된다.



 PDF Links
 PubReader
 ePub Link
 XML Download
 Full text via DOI
 Download Citation
 Print
Print