J Korean Ophthalmol Soc > Volume 61(5); 2020 > Article
스테로이드 노출 수정체 상피세포에서 중합효소연쇄반응 방법을 통한 유전자의 발현 변화

국문초록

목적

수정체 상피세포에 덱사메타손을 처리한 후 polymerase chain reaction (PCR) array을 이용하여 84개 유전자들의 발현 변화를 조사하였다.

대상과 방법

수정체 상피세포에 0.01, 0.1, 1 mg/mL 농도의 덱사메타손을 처리한 후 세포생존율과 이동성 변화를 조사하였으며, fibronectin, α-smooth muscle actin (α-SMA), E-cadherin 발현 확인을 위한 Western blot를 시행하였다. 그리고 0.1 mg/mL 농도의 덱사메타손을 24, 48, 72시간 처리한 후 84개 성장 인자의 발현 변화를 PCR array로 조사하였다.

결과

덱사메타손 0.01과 0.1 mg/mL 농도에서 세포생존율의 의미있는 변화는 관찰되지 않았으며, 1 mg/mL 농도에서는 현저한 세포 독성을 나타내었다. 세포 이동성은 덱사메타손 0.01과 0.1 mg/mL 농도에서 농도 의존적으로 증가하였다. Western blot에서 fibronectin은 덱사메타손의 모든 농도, α-SMA는 0.01 mg/mL에서 의미 있게 증가하였으며, E-cadherin 은 모든 농도에서 의미 있는 감소를 나타내었다. PCR array에서 FGF1, FGF2, IL-11 등과 세포자멸사에 관여하는 인자인 GDNF, IL-1β, NRG2, 그리고 세포 분화와 관련된 BMP5, FGF1, FGF2, FGF5는 2배 이상 감소하였고, FGF9, FGF19은 2배 이상 증가하였다. 발달 조절 인자인 BDNF, NGF, DKK1, NRG1, NRG2, LIF, INHBA는 2배 이상 감소하였고 CSPG5, FIGF, NODAL은 2배 이상 증가하였다.

결론

수정체 상피세포에서 덱사메타손 노출시킨 후 실시한 PCR array을 통해 스테로이드 유발 백내장에 관여하는 후보 물질을 발굴하는 데에 도움을 줄 수 있을 것으로 생각된다.

ABSTRACT

Purpose

We investigated the expression levels of 84 genes in dexamethasone-exposed human lens epithelial cells using polymerase chain reaction (PCR) array analysis.

Methods

The viability and motility of lens epithelial cells were examined after treatment with dexamethasone at 0.01, 0.1, and 1 mg/mL; Western blot was used to evaluate the expression levels of fibronectin, α-smooth muscle actin (α-SMA), and E-cadherin. After 24, 48, and 72 hours of dexamethasone treatment at 0.1 mg/mL, the expression levels of 84 growth factors were analyzed using PCR array.

Results

Cell viability did not change significantly at dexamethasone levels of 0.01 or 0.1 mg/mL, but decreased markedly at 1 mg/mL; motility increased in a concentration-dependent manner at 0.01 and 0.1 mg/mL. Western blot showed that fibronectin levels increased significantly at all dexamethasone concentrations tested; the α-SMA level increased only at 0.01 mg/mL, and E-cadherin levels decreased significantly at all tested concentrations. PCR showed that the levels of FGF1, FGF2, IL-11, regulators of apoptosis (GDNF, IL-1β, and NRG2), and regulators of cell differentiation (BMP5, FGF1, FGF2, and FGF5) decreased more than twofold, whereas the levels of FGF9 and FGF19 increased more than twofold.

Conclusions

PCR performed after exposure of lens epithelial cells to dexamethasone may identify the genes involved in the development of steroid-induced cataracts.

백내장은 황반변성, 녹내장 등과 더불어 시력저하를 일으키는 안과 질환 중 하나로, 여전히 전 세계적으로 주요한 실명의 원인으로 알려져 있다[1]. 수술 도구나 기법의 발달로 백내장으로 인해 실명이 되는 환자는 감소하고 있으나, 인구의 고령화가 진행됨으로써 그에 따른 환자들의 비용 부담과 함께 사회 경제적 비용도 증가하는 것으로 보고되고 있다[2]. 백내장의 원인에는 선천적 요인 뿐만 아니라 후천적, 환경적 요인이 작용하며, 그 발생 위험인자로는 고령, 당뇨, 스테로이드, 외상, 그리고 자외선 노출 등이 알려져 있다[3]. 이 중에서 스테로이드 유발 백내장은 전신적으로나 점안 스테로이드를 투여 받은 환자에서 발생하는 백내장으로 정의되는데, 평균 수명의 연장과 더불어 자가 면역질환 등 장기적인 스테로이드 치료가 필요한 질환의 증가 등으로 인해 유병률이 점차 높아지는 백내장의 아형으로 보고되고 있다[4]. 스테로이드 유발 백내장은 임상적으로 중심성 후낭하혼탁의 형태로 나타나게 되는데, 이에 따라 조기에 시력 저하나 눈부심 등이 생기게 된다. 뿐만 아니라 수술 중에는 후낭파열이 생길 위험성이 높으며, 수술 후에는 후낭혼탁이 쉽게 발생하여 추가적인 비용을 발생시키게 된다[5-7]. 이런 임상적인 중요성에도 불구하고 스테로이드 유발 백내장에 대한 기전이나 예방에 대한 연구는 당뇨병성 백내장이나 연령관련 백내장보다 적은 것이 현실이다. 본 연구에서는 수정체 상피세포를 이용하여 스테로이드가 수정체 상피세포에 미치는 영향을 확인하고 이를 polymerase chain reaction (PCR) array 방법을 통해 유전자들의 발현 변화를 확인함으로써 스테로이드 유발 백내장의 병리 기전을 알아보고자 한다.

대상과 방법

세포 배양 및 처치

인간 수정체 상피(Human lens epithelial B3, HLE-B3) 세포는 American Type Culture Collection (ATCC, Rockville, MD, USA)에서 구입하였다. HLE-B3 세포를 10% fetal bovine serum (FBS) 및 1% penicillin/streptomycin (Gibco BRL, Grand Island, NY, USA)을 첨가한 Dulbecco's modified Eagle's (DMEM) 배지에서 배양하였다. 세포를 가습된 CO2 배양기에서 37°C로 유지시켰다. 대조군 세포는 덱사메타손(Sigma-Aldrich, St. Louis, MO, USA)을 처리하지 않았으며 처치군 세포는 3군(0.01, 0.1, 1 mg/mL)으로 나누어 24, 48, 72시간 동안 덱사메타손을 처리하였다.

세포 생존 분석

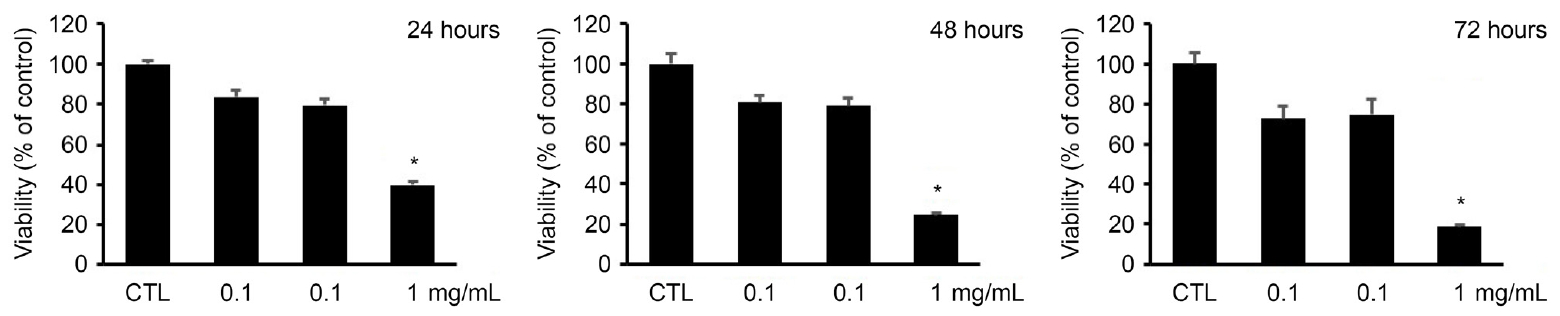
HLE-B3 세포를 well당 5×10⁴ 세포의 밀도로 24-well 배양 플레이트에 접종하고 24시간 동안 부착시켰다. 다음날, 세포를 24, 48, 72시간 동안 다양한 농도의 덱사메타손(0, 0.01, 0.1 및 1 mg/mL)로 처리하였다. Cell Counting Kit-8 (CCK-8, Dojindo Laboratories, Kumamoto, Japan)을 사용하여 세포 성장을 평가하였다. 10 μL의 CCK-8 용액을 각 well에 첨가하고 95% 공기 및 5% CO2의 가습 환경에서 37°C에서 1시간 동안 배양했다. 황색 formazan 염색량을 ELISA 플레이트 판독기(Molecular Devices, Sunnyvale, CA, USA)를 사용하여 450 nm에서 흡광도를 측정하였다.

세포 이동성 분석

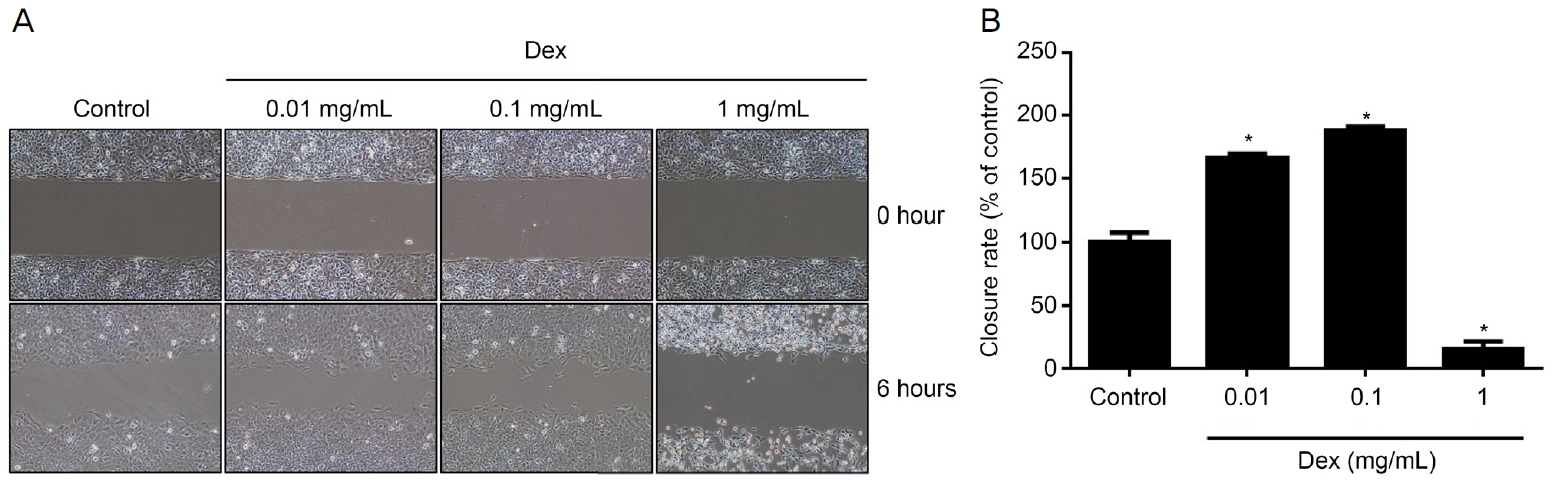
세포의 운동성은 wound healing assay chambers (ibidi GmbH, Munich, Germany)를 이용하여 측정하였다. FBS를 함유하는 DMEM에 현탁한 후, 4×10⁴개의 HLE-B3 세포를 각각의 well에 접종하고 24시간동안 배양 플레이트에 부착시켰다. 다음 날, wound assay chambers 제거하고 현미경 이미지를 얻었다. 그 후, 세포를 덱사메타손으로 6시간 동안 처리하고 위상차현미경을 사용하여 이미지화하였다. 이미지 분석은 Nikon NIS Elements (Nikon, Tokyo, Japan) 소프트웨어를 사용하였다.

Western blot assay

세포 추출물은 protease inhibitor와 phosphatase inhibitor cocktail (Thermo-Fisher Scientific, Waltham, MA, USA)가 첨가된 radioimmunoprecipitation assay (RIPA) lysis 완충액(Santa Cruz Biotechnology, Santa Cruz, CA, USA)를 사용하였다. 세포를 2분 동안 초음파 처리하고 4°C에서 10분 동안 12,000 g에서 원심 분리하여 불용성 세포 잔해를 제거하였다. 용해된 세포의 단백질 농도는 bicinchoninic acid (BCA) 단백질 분석 키트(Pierce, Rockford, IL, USA)로 측정하였다. 총 50 μg의 단백질을 10% sodium dodecyl sulfate polyacrylamide 겔 전기 영동으로 분리하고 nitrocellulose membrane (Millipore, Bedford, MA, USA)으로 옮겼다. 각각의 blot에 fibronectin, α-smooth muscle actin (α-SMA), E-cadherin (Santa Cruz Biotechnology) 및 β-actin (Sigma-Aldrich)의 일차 항체를 배양하였다. 이후 이차 항체로 horseradish peroxidase-conjugated anti-rabbit immunoglobulin G (IgG) 혹은 anti-mouse IgG (Cell Signaling Technology, Inc., Beverly, MA, USA)를 배양하였다. 각각의 신호는 Supersignal Chemiluminescent Substrate (Pierce)를 사용하여 시각화하였다. 이미지는 ChemiDoc Touch Imaging System (Bio-Rad, Hercules, CA, USA)으로 획득하였고 농도 측정은 Image J (NIH, Bethesda, MD, USA)를 이용하였다.

Real time (RT)-PCR array 분석

덱사메타손이 처리된 세포에서 84개의 인간 성장 인자 관련 유전자의 발현을 384개의 well (Qiagen, Valencia, CA, USA)에서 정량적 RT-PCR array를 사용하여 동시에 분석하였다(Table 1). 덱사메타손 0.1 mg/mL를 세포에 처치한 후 24, 48, 72시간 배양 후 RNeasy kit (Qiagen)를 사용하여 HLE-B3 세포에서 전체 RNA를 분리하였다. 추출된 RNA에 오염된 Genomic DNA는 RNase-Free DNase set (Qiagen)을 이용하여 제거하였다. 총 RNA (5 μg)는 RT2 First Strand Kit (Qiagen)을 사용하여 10 μL의 반응 부피의 cDNA로 변환하였다. 변환된 cDNA를 RT2 SYBR Green Mastermix (Qiagen) 및 증류수로 4,200 μL의 부피로 희석시켰다. 그 후, 10 μL의 cDNA를 인간 성장 인자 RT2 Profiler PCR Array (Qiagen)의 각 primer 세트와 제조사의 프로토콜에 따라 결합시켰다. 증폭 반응은 ViiA7 Real-Time PCR System (Applied Biosystems, Foster City, CA, USA)에서 자동화된 기준점 및 역치 주기 검출을 사용하였다. 성장 인자 관련 유전자의 상대적 발현은 4개의 내장된 housekeeping 유전자에 대해 정성화하였다. 각 그룹은 웹 기반 소프트웨어인 RT2 Profiler PCR Array Data Analysis (SABiosciences Corp., Frederick, MD, USA)를 이용하여 비교하였으며, 이 소프트웨어에서 TargetScan 알고리즘과 miRBase의 miRNome의 검색을 통해 miRNA 조절 유전자 결과를 얻었다.

통계분석

정량화 가능한 결과는 최소 세 번의 독립적인 실험을 통한 평균 ± 표준 편차로 표시하였다. 통계 분석은 GraphPad Prism (version 6.0) (GraphPad Software, San Diego, CA, USA)을 사용하였다. Microsoft Excel (Microsoft, Redmond, WA, USA)을 사용하여 그래프를 작성하였고 통계적 유의성은 Student's t-test를 이용하였으며, p<0.05인 경우 통계적으로 유의한 것으로 하였다.

결 과

HLE-B3 세포 생존에 덱사메타손의 영향

각각 다른 농도의 덱사메타손(0.01, 0.1, 1 mg/mL)에 24, 48, 72시간 노출시킨 후 대조군과 비교하였을 때 0.01, 0.1 mg/mL의 농도에서는 세포 생존율이 감소 경향을 보였으나 이는 통계적인 의미가 없었으며, 1 mg/mL의 덱사메타손에 노출 시에는 24, 48, 그리고 72시간 모두에서 세포 생존이 유의하게 감소함을 보였다(Fig. 1).

HLE-B3 세포 창상 회복에 덱사메타손의 영향

덱사메타손을 처리하지 않은 대조군과 비교하였을 때, 0.01, 0.1 mg/mL 농도의 덱사메타손에 6시간 노출 시 농도에 따른 세포 이동의 증가를 확인할 수 있었지만, 1 mg/mL 덱사메타손에 노출한 경우 대조군에 비해 세포의 이동의 감소가 의미 있게 나타났다(Fig. 2).

HLE-B3 세포의 상피-중간엽 이행에 덱사메타손의 영향

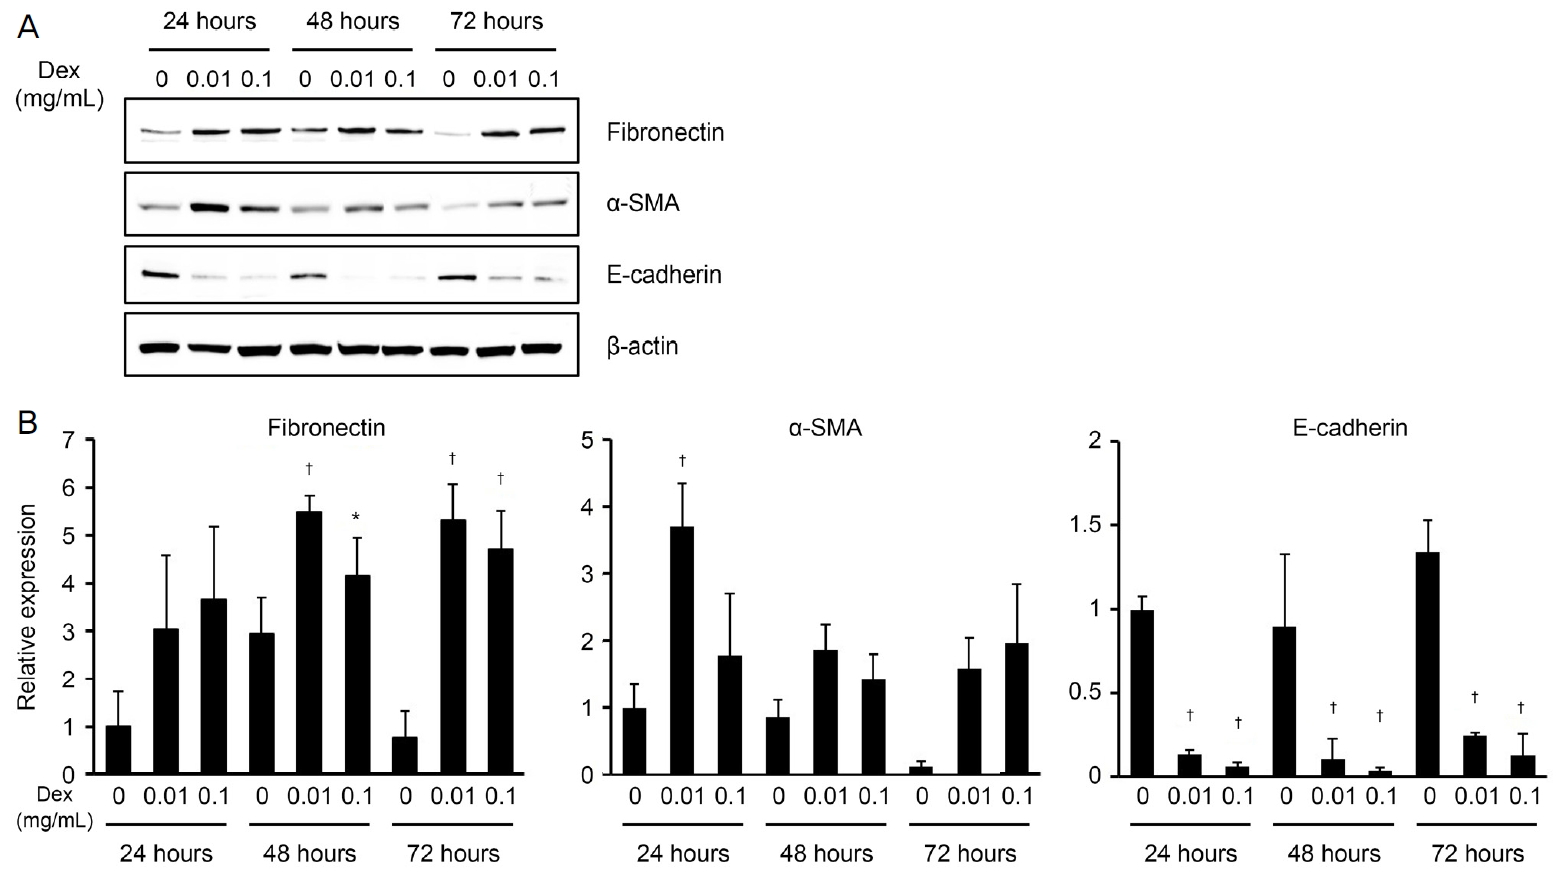
0.01과 0.1 mg/mL 농도의 덱사메타손에 24, 48, 72시간 노출시킨 후 epithelial-mesenchymal transition (EMT)에 관여하는 표지자들의 발현 변화를 확인해 본 결과, fibronectin은 덱사메타손 노출 후 48, 72시간의 모든 농도에서 대조군에 비해 증가하는 것을 확인하였으며, α-SMA는 대조군에 비해 전반적으로 증가하는 경향을 보였으나, 통계적으로는 0.01 mg/mL의 농도로 24시간 처리한 군에서만 통계학적으로 의미 있는 증가를 보였다. 반면에 상피세포의 표지자인 E-cadherin의 mRNA의 발현은 모든 노출 시간과 농도에서 대조군에 비해 의미 있게 감소하는 소견을 관찰할 수 있었다(Fig. 3).

PCR array 결과

PCR array에서 chondroitin sulfate proteoglycan (CSPG) 5가 덱사메타손 처치 후 24, 48, 72시간 모두에서 약 2배 (1.9593; 2.3975; 2.0076)로 발현 증가하였으며 24시간 노출 시 fibroblast growth factor (FGF) 11, C-fos induced growth factor (FIGF), glucose-6-phosphate isomerase (GPI), interleukin (IL) 12B, inhibin, alpha (INHA), nodal homolog (NODAL), solute carrier (SLCO1A)2와 48시간 노출 시 FGF19, INHA, NODAL, neurturin (NRTN), 72시간 노출 시 bone morphogenetic protein (BMP) 6, FGF9이 의미 있게 증가하였다(Table 2). 반면에 brain-derived neurotrophic factor (BDNF), BMP5, dickkopf homolog (DKK) 1, FGF1, FGF2, FGF5, glial cell derived neurotrophic factor (GDNF), heparin-binding EGF-like growth factor (HBEGF), IL11, inhibin, beta A (INHBA), leukemia inhibitory factor (LIF), nerve growth factor (NGF), neuregulin (NRG) 1, pleiotrophin (PTN)은 모든 노출 시간에서 발현 감소를 보였으며, IL1B는 24, 72시간 덱사메타손 노출 시 감소하고 vascular endothelial growth factor C (VEGFC)는 48시간 덱사메타손에 노출 시 감소하는 소견을 보였다(Table 3). RT2 Profiler PCR Array Data Analysis의 TargetScan 알고리즘과 miRBase의 miRNome의 검색을 통해 후보자 miRNA를 검색하여 표와 같은 결과를 얻었다(Table 4).

고 찰

본 연구에서 수정체 상피세포에서 스테로이드에 노출 시 EMT에 미치는 영향과 이를 PCR array를 이용하여 유전자들이 발현의 변화를 살펴보았다. 수정체 상피세포에 덱사메타손을 처리하면 농도 의존적으로 세포의 생존율이 감소하며, 세포의 이동과 상피-중간엽 이행 표지자의 발현 증가를 확인할 수 있었으며, PCR array에서 여러 성장인자들의 발현의 증가와 감소를 확인할 수 있었다.
장기간의 전신적 또는 국소 스테로이드의 사용은 백내장 발생을 증가시킨다고 알려져 있으며 특히 후낭하혼탁 백내장 발생에 연관성이 있다고 알려져 있다[4,5]. 이전의 연구에서 국소 스테로이드를 점안 후 약 15-30분 후 전방수에서 스테로이드가 측정이 되며, 0.1% mg/mL의 현탁액을 점안한 경우 91-120분에 최고 농도로 다다르며 이는 약 31 ng/mL 정도로 보고되고 점안 후 12시간까지 전방수에서 측정됨이 알려져 있다[8]. 또한 전신적 스테로이드 사용 후 안구 조직 내로 이동되는 농도에 대한 동물 연구에서 전신으로 투여되는 스테로이드 양의 약 0.5-1%의 스테로이드가 안구 내에서 발견되는 것으로 알려져 있고 장기간 사용할수록 더 높은 양이 발견되는 것으로 보고되었다[9]. 따라서, 류마티스 질환이나 흡입용 스테로이드를 사용하는 폐질환의 증가는 스테로이드 사용의 증가로 이어지고 이는 스테로이드 유발 백내장의 발생을 증가시키는 결과를 가져오게 된다[10,11]. 따라서 평균 수명 증가에 따른 연령 증가는 연령에 따른 백내장과 더불어 스테로이드 유발 백내장 발생률의 증가가 예상된다. 하지만 이러한 임상적 중요성의 증가에도 스테로이드 유발 백내장의 발생 병리기전에 대한 연구는 미흡한 상태이다.
스테로이드 유발 백내장의 발생 기전에 대해 수정체 글루티코르티코이드수용체의 역할에 대한 연구가 잘 알려져 있다[5,12-14]. 사실 후낭하혼탁 형태로 발생하는 스테로이드 유발 백내장에서 원래 수정체상피세포가 존재하지 않는 후낭으로 세포가 이동할 수 있도록 이동성이 증가하여야 하며, 이후에 이동한 세포에서 상피-중간엽 이행이 발생하여 백내장이 생긴다고 한다[5,13,15]. 본 연구에서도 수정체 상피세포에 독성을 유발하지 않는 스테로이드 농도(0.01, 0.1 mg/mL)에서 세포의 이동이 대조군에 비해 유의하게 증가됨을 확인할 수 있었다. 또한 스테로이드에 노출된 수정체 상피세포에서 EMT의 표지자인 fibronectin과 α-SMA를 유도하는 mRNA의 발현이 대조군과 비교하여 유의하게 증가하였으며, 상피세포의 표지자인 E-cadherin의 mRNA의 발현은 의미 있게 감소함을 확인함으로써 스테로이드에 노출된 수정체 상피세포의 EMT 증가를 확인할 수 있었다.
상피-중간엽 이행과 관련된 성장인자들의 역할에 대해 많은 연구들이 있다. Jobling and Augusteyn [4]은 후낭하혼탁 백내장에서 처음으로 안구내 성장인자의 역할을 보고하였으며, 이들 중 수정체 상피세포의 증식과 섬유세포로의 분화에 관련된 성장인자로 FGF2, IGF1, EGF, TGFβ, LEDGF, platelet derived growth factor (PDGF), BMP 등이 있다고 보고하고 있다[16-27]. 이번 연구에서 수정체 상피세포의 스테로이드 처리 후 PCR array를 통한 성장인자 분석 시 이미 알려진 성장인자 이외에도 BMP6, CSPG5, FGF9, FGF11, FGF19, FIGF, GPI, IL12B, INHA, NODAL, NRTN, SLCO1A2가 대조군에 비해 의미 있게 증가하는 성장인자로 나타났고, 반면에 BDNF, BMP5, DKK1, FGF1, FGF5, GDNF, HBEGF, IL11, INHBA, LIF, NGF, NRG1, PTN, VEGFC는 스테로이드를 처리한 수정체 상피세포에서 발현이 감소되는 것을 확인하였다.
수정체 상피세포에 덱사메타손 처리 후 발현이 증가하는 성장인자들 중 특이한 것은 NGF나 CSPG와 같은 신경유래 성장인자들이 증가하거나 감소하는 등의 발현 변화가 관찰된 것이다. 우선 NGF는 덱사메타손 처리 후에 수정체 상피세포에서 발현이 감소하는 것으로 결과가 나왔다. NGF는 이전 연구에서 수정체상피세포에서 자체적으로 발현이 되며, 실험적으로 그 발현이 감소하는 것이 당에 의한 백내장 발생에 관여한다는 보고가 있는데[28], 이는 이번 우리 연구와 일치하는 결과이다. 그리고 CSPG5는 발생 시기의 수정체 소포에서 발현이 되는데, 이때 장애가 발생시 수정체의 형성에 문제를 일으키는 것으로 보고되었으며, FGF2와 연관되어 작용하는 것으로 알려져 있다[29]. CSPG5는 neuroglycan C라고도 불리며 망막색소상피세포와 신경세포에서 주로 발견되며, 쥐에서 망막변성에 관여하는 인자로 보고되었다[29-32]. 하지만 CSPG5의 신호전달 체계의 확립이 되어 있지 않으며, 수정체에 대한 역할의 보고는 없다. 따라서 CSPG5의 역할 규명은 수정체 상피세포의 상피-중간엽 이행에 대한 이해와 스테로이드 유발 백내장의 발생 기전에 도움이 될 것으로 생각된다.
FGF는 수정체 상피세포의 증식과 섬유세포로의 분화를 촉진시키는 성장인자로 알려져 있으며[27], PDGF가 Phosphoinositide 3-kinase와 Mitogen-Activated Protein Kinase 신호전달 체계를 통해 FGF의 수정체 상피세포에 대한 역할을 촉진시키는 것으로 알려져 있다[33]. 본 연구에서 후보자 유전자로 선정된 FGF19은 아직까지 백내장 발생과 관련된 연구는 없으나 닭의 배아에서 눈 발생에 있어서 관여한다는 연구가 있으며[34,35], 제브라피시의 수정체의 발달에 FGF19이 관여하며[36], FGF19-FGFR4 신호전달 과정을 통해 수정체 형성을 한다는 보고가 있어[37], FGF19이 백내장 발생에도 관련이 있음을 추론해 볼 수 있겠다.
본 연구는 HLE-B3 세포를 이용한 연구로 일차세포가 아닌 세포계를 이용한 in vitro 실험이라는 제한점이 있으며, 이는 추후 in vivo 실험이나 수정체낭의 일차 배양을 통한 일차세포를 이용한 실험 등이 필요할 것으로 생각이 되며, 각각의 성장인자들의 역할과 신호전달체계에 대한 후속 연구가 필요하다. 결론적으로 수정체 상피세포에서 덱사메타손 노출은 세포 생존율 감소와 세포 이동과 관련된 인자들의 발현을 증가시키며, PCR array 방법은 스테로이드 유발 백내장에 관여하는 후보 물질을 발굴하고 이를 통해 스테로이드 유발 백내장의 억제 물질 발견 및 치료제 개발에 도움이 될 것으로 판단이 된다.

NOTES

Conflict of Interest

The authors have no conflicts to disclose.

Figure 1.
The effect of dexamethasone on cell viability in HLE-B3. The graphs showed significantly decreased cell viability of HLE-B3 in 1 mg/mL of dexamethasone for 24, 48, and 72 hours. CTL = control. *p < 0.01 compared with control cells, as evaluated using the student’s t-test.
jkos-2020-61-5-472f1.jpg
Figure 2.
The effect of dexamethasone on wound healing assay in HLE-B3. (A) Representative phase-contrast pictures revealed migration of cells treated with various concentrations (0, 0.01, 0.1, 1 mg/mL) of dexamethasone at 0 hours (immediately after culture inserts were removed) and 6 hours after the scratch. (B) The graphs showed closure rate were significantly increased in 0.01 and 0.1 mg/mL of dexamethasone, while closure rate was significantly decreased in 1 mg/mL of dexamethasone compared to control. Dex = dexamethasone. *p < 0.001 compared with control cells, as evaluated using the student’s t-test.
jkos-2020-61-5-472f2.jpg
Figure 3.
The effect of dexamethasone on epithelial-mesenchymal transition (EMT) in HLE-B3. (A) Western blot of EMT marker revealed relative increase of fibronectin and α-smooth muscle actin (SMA) in dexamethasone treatment compared to control, while decrease of E-cadherin. (B) The graphs of densitometry showed mesenchymal markers (fibronectin, α-SMA) were increased and epithelial marker (E-cadherin) was decreased in dexamethasone group. CTL = control; Dex = dexamethasone. *p < 0.05; p < 0.01versus control cells, as evaluated using the student’s t-test.
jkos-2020-61-5-472f3.jpg
Table 1.
List of genes in PCR array
Position UniGene GenBank Symbol Description
A01 Hs.112432 NM_000479 AMH Anti-Mullerian hormone
A02 Hs.502182 NM_001709 BDNF Brain-derived neurotrophic factor
A03 Hs.1274 NM_006129 BMP1 Bone morphogenetic protein 1
A04 Hs.158317 NM_014482 BMP10 Bone morphogenetic protein 10
A05 Hs.73853 NM_001200 BMP2 Bone morphogenetic protein 2
A06 Hs.387411 NM_001201 BMP3 Bone morphogenetic protein 3
A07 Hs.68879 NM_130851 BMP4 Bone morphogenetic protein 4
A08 Hs.296648 NM_021073 BMP5 Bone morphogenetic protein 5
A09 Hs.285671 NM_001718 BMP6 Bone morphogenetic protein 6
A10 Hs.473163 NM_001719 BMP7 Bone morphogenetic protein 7
A11 Hs.664022 NM_001720 BMP8B Bone morphogenetic protein 8b
A12 Hs.170310 NM_177405 CECR1 Cat eye syndrome chromosome region, candidate 1
B01 Hs.889 NM_001828 CLC Charcot-Leyden crystal protein
B02 Hs.591402 NM_000757 CSF1 Colony stimulating factor 1 (macrophage)
B03 Hs.1349 NM_000758 CSF2 Colony stimulating factor 2 (granulocyte-macrophage)
B04 Hs.2233 NM_000759 CSF3 Colony stimulating factor 3 (granulocyte)
B05 Hs.45127 NM_006574 CSPG5 Chondroitin sulfate proteoglycan 5 (neuroglycan C)
B06 Hs.789 NM_001511 CXCL1 Chemokine (C-X-C motif) ligand 1 (melanoma growth stimulating activity, alpha)
B07 Hs.40499 NM_012242 DKK1 Dickkopf homolog 1 (Xenopus laevis)
B08 Hs.436186 NM_016442 ERAP1 Endoplasmic reticulum aminopeptidase 1
B09 Hs.115263 NM_001432 EREG Epiregulin
B10 Hs.483635 NM_000800 FGF1 Fibroblast growth factor 1 (acidic)
B11 Hs.655193 NM_004112 FGF11 Fibroblast growth factor 11
B12 Hs.6540 NM_004114 FGF13 Fibroblast growth factor 13
C01 Hs.508616 NM_004115 FGF14 Fibroblast growth factor 14
C02 Hs.248192 NM_003867 FGF17 Fibroblast growth factor 17
C03 Hs.249200 NM_005117 FGF19 Fibroblast growth factor 19
C04 Hs.284244 NM_002006 FGF2 Fibroblast growth factor 2 (basic)
C05 Hs.248087 NM_020637 FGF22 Fibroblast growth factor 22
C06 Hs.287370 NM_020638 FGF23 Fibroblast growth factor 23
C07 Hs.37055 NM_004464 FGF5 Fibroblast growth factor 5
C08 Hs.166015 NM_020996 FGF6 Fibroblast growth factor 6
C09 Hs.567268 NM_002009 FGF7 Fibroblast growth factor 7
C10 Hs.111 NM_002010 FGF9 Fibroblast growth factor 9 (glia-activating factor)
C11 Hs.11392 NM_004469 FIGF C-fos induced growth factor (vascular endothelial gro
C12 Hs.2171 NM_004962 GDF10 Growth differentiation factor 10
D01 Hs.643604 NM_005811 GDF11 Growth differentiation factor 11
D02 Hs.248114 NM_000514 GDNF Glial cell derived neurotrophic factor
D03 Hs.466471 NM_000175 GPI Glucose-6-phosphate isomerase
D04 Hs.799 NM_001945 HBEGF Heparin-binding EGF-like growth factor
D05 Hs.160562 NM_000618 IGF1 Insulin-like growth factor 1 (somatomedin C)
D06 Hs.523414 NM_000612 IGF2 Insulin-like growth factor 2 (somatomedin A)
D07 Hs.193717 NM_000572 IL10 Interleukin 10
D08 Hs.467304 NM_000641 IL11 Interleukin 11
D09 Hs.674 NM_002187 IL12B Interleukin 12B (natural killer cell stimulatory factor 2, cytotoxic lymphocyte maturation factor 2, p40)
D10 Hs.83077 NM_001562 IL18 Interleukin 18 (interferon-gamma-inducing factor)
D11 Hs.1722 NM_000575 IL1A Interleukin 1, alpha
D12 Hs.126256 NM_000576 IL1B Interleukin 1, beta
E01 Hs.89679 NM_000586 IL2 Interleukin 2
E02 Hs.694 NM_000588 IL3 Interleukin 3 (colony-stimulating factor, multiple)
E03 Hs.73917 NM_000589 IL4 Interleukin 4
E04 Hs.407506 NM_002191 INHA Inhibin, alpha
E05 Hs.583348 NM_002192 INHBA Inhibin, beta A
E06 Hs.1735 NM_002193 INHBB Inhibin, beta B
E07 Hs.728907 NM_000214 JAG1 Jagged 1
E08 Hs.433445 NM_002226 JAG2 Jagged 2
E09 Hs.656214 NM_020997 LEFTY1 Left-right determination factor 1
E10 Hs.520187 NM_003240 LEFTY2 Left-right determination factor 2
E11 Hs.2250 NM_002309 LIF Leukemia inhibitory factor (cholinergic differentiation factor)
E12 Hs.466766 NM_003573 LTBP4 Latent transforming growth factor beta binding protein 4
F01 Hs.82045 NM_002391 MDK Midkine (neurite growth-promoting factor 2)
F02 Hs.41565 NM_005259 MSTN Myostatin
F03 Hs.522615 NM_000266 NDP Norrie disease (pseudoglioma)
F04 Hs.2561 NM_002506 NGF Nerve growth factor (beta polypeptide)
F05 Hs.370414 NM_018055 NODAL Nodal homolog (mouse)
F06 Hs.453951 NM_013957 NRG1 Neuregulin 1
F07 Hs.408515 NM_013982 NRG2 Neuregulin 2
F08 Hs.125119 NM_001010848 NRG3 Neuregulin 3
F09 Hs.234775 NM_004558 NRTN Neurturin
F10 Hs.99171 NM_002527 NTF3 Neurotrophin 3
F11 Hs.128055 NM_182981 OSGIN1 Oxidative stress induced growth inhibitor 1
F12 Hs.570855 NM_016205 PDGFC Platelet derived growth factor C
G01 Hs.252820 NM_002632 PGF Placental growth factor
G02 Hs.248159 NM_004158 PSPN Persephin
G03 Hs.371249 NM_002825 PTN Pleiotrophin
G04 Hs.46440 NM_021094 SLCO1A2 Solute carrier organic anion transporter family, member 1A2
G05 Hs.313 NM_000582 SPP1 Secreted phosphoprotein 1
G06 Hs.385870 NM_003212 TDGF1 Teratocarcinoma-derived growth factor 1
G07 Hs.645227 NM_000660 TGFB1 Transforming growth factor, beta 1
G08 Hs.1166 NM_000460 THPO Thrombopoietin
G09 Hs.631558 NM_003283 TNNT1 Troponin T type 1 (skeletal, slow)
G10 Hs.592212 NM_001953 TYMP Thymidine phosphorylase
G11 Hs.73793 NM_003376 VEGFA Vascular endothelial growth factor A
G12 Hs.435215 NM_005429 VEGFC Vascular endothelial growth factor C
Table 2.
List of over-expressed genes compared to control group
Treatment time (hours) Symbol Fold regulation p-value*
24 CSPG5 1.9593 0.002
FGF11 1.4945 0.018
FIGF 2.7424 0.015
GPI 1.2497 0.017
IL12B 2.1265 0.022
INHA 1.5887 0.038
NODAL 1.8208 0.015
SLCO1A2 2.0629 <0.001
48 CSPG5 2.3975 0.002
FGF19 3.2913 0.035
INHA 1.7735 0.010
NODAL 2.0471 0.002
NRTN 1.3215 0.026
72 BMP6 2.9498 0.011
CSPG5 2.0076 0.004
FGF9 4.9506 0.016

CSPG5 = chondroitin sulfate proteoglycan 5; FGF11 = fibroblast growth factor 11; FIGF = C-fos induced growth factor; GPI = glucose-6-phosphate isomerase; IL12B = interleukin 12B; INHA = inhibin, alpha; NODAL = nodal homolog; SLCO1A = solute carrier organic anion transporter family, member 1A2; NRTN = neurturin; BMP6 = bone morphogenetic protein 6.

* The p-values are calculated based on a student t-test of the replicate values for each gene in the control group and treatment groups.

Table 3.
List of under-expressed genes compared to control group
Treatment time (hours) Symbol Fold Regulation p-value*
24 BDNF -2.2171 0.033
BMP3 -1.4162 0.025
BMP5 -14.1983 0.007
DKK1 -2.2101 0.024
FGF1 -5.3166 <0.001
FGF2 -1.6152 0.034
FGF5 -2.3940 0.001
GDNF -2.4611 0.009
HBEGF -4.7389 0.001
IL11 -4.8919 0.001
IL1B -2.4053 0.004
INHBA -2.4999 0.001
LIF -3.0640 0.001
NGF -5.7235 0.001
NRG1 -3.5381 <0.001
NRG2 -2.0963 0.001
PTN -2.1381 0.003
48 BDNF -2.6076 0.023
BMP5 -24.348 0.005
CSF2 -4.5479 0.015
DKK1 -3.6360 0.003
FGF1 -14.1946 <0.001
FGF2 -1.8586 0.019
FGF5 -3.1228 0.001
GDNF -4.2029 0.003
GPI -1.2300 0.042
HBEGF -7.2166 <0.001
IL11 -5.8300 <0.001
INHBA -4.5339 <0.001
LIF -3.8573 <0.001
NGF -5.5075 0.001
NRG1 -5.4341 <0.001
NRG2 -1.8586 0.044
NRTN 1.6124 0.026
OSGIN1 -2.4951 0.030
PGF -2.1297 0.013
PTN -1.9103 0.006
SLCO1A2 -1.7586 0.007
TGFB1 -1.5063 0.012
VEGFC -1.3886 0.005
72 BDNF -2.6342 0.022
BMP1 -2.4719 0.022
BMP3 -1.9116 0.017
BMP5 -14.7667 0.007
CSF2 -6.6266 0.011
DKK1 -3.4652 0.003
FGF1 -32.5026 <0.001
FGF2 -2.6041 0.008
FGF5 -4.2442 <0.001
GDF11 -2.9371 0.032
GDNF -5.6102 0.003
GPI -2.6866 0.012
HBEGF -16.5348 <0.001
IL11 -6.6797 <0.001
IL1B -3.0850 0.002
INHBA -5.4952 <0.001
LIF -4.7370 0.001
NGF -6.2932 0.001
NRG1 -6.6517 <0.001
OSGIN1 -3.3487 0.025
PGF -2.7404 0.020
PTN -2.8094 0.001
TGFB1 -2.1278 0.024
VEGFC -1.3467 0.006

BDNF = brain-derived neurotrophic factor; BMP = bone morphogenetic protein; DKK = dickkopf homolog; FGF = fibroblast growth factor; GDNF = glial cell derived neurotrophic factor; HBEGF = heparin-binding EGF-like growth factor; IL = interleukin; INHBA = inhibin, beta A; LIF = leukemia inhibitory factor; NGF = nerve growth factor; NRG = neuregulin; PTN = pleiotrophin; CSF = colony stimulating factor; GPI = glucose-6-phosphate isomerase; NRTN = neurturin; OSGIN = oxidative stress induced growth inhibitor; PGF = placental growth factor; SLCO1A2 = solute carrier organic anion transporter family, member 1A2; TGFB1 = transforming growth factor, beta 1; VEGFC = vascular endothelial growth factor C.

* The p-values are calculated based on a student t-test of the replicate values for each gene in the control group and treatment groups.

Table 4.
Candidate miRNA regulating genes from RT2 profiler data analysis software
miRNAs Regulation Target genes
miR-548k Up CSPG5
miR-302b-3p Up FGF19
miR-373-3p Up FGF19
miR-302a-3p Up FGF19
miR-520c-3p Up FGF19
miR-302c-3p Up FGF19
miR-302d-3p Up FGF19
miR-520d-3p Up FGF19
miR-520a-3p Up FGF19
miR-520b Up FGF19
miR-520e Up FGF19
miR-372-3p Up FGF19
miR-302e Up FGF19

RT = real time; CSPG5 = chondroitin sulfate proteoglycan 5; FGF19 = fibroblast growth factor 19.

REFERENCES

1) Bourne RR, Stevens GA, White RA, et al. Causes of vision loss worldwide, 1990-2010: a systematic analysis. Lancet Glob Health 2013;1:e339-49.
crossref pmid
2) Brown GC, Brown MM, Menezes A, et al. Cataract surgery cost utility revisited in 2012: a new economic paradigm. Ophthalmology 2013;120:2367-76.
crossref pmid
3) West SK, Valmadrid CT. Epidemiology of risk factors for age-related cataract. Surv Ophthalmol 1995;39:323-34.
crossref pmid
4) Jobling AI, Augusteyn RC. What causes steroid cataracts? A review of steroid-induced posterior subcapsular cataracts. Clin Exp Optom 2002;85:61-75.
crossref pmid
5) James ER. The etiology of steroid cataract. J Ocul Pharmacol Ther 2007;23:403-20.
crossref pmid
6) Zaczek A, Zetterström C. Posterior capsule opacification after phacoemulsification in patients with diabetes mellitus. J Cataract Refract Surg 1999;25:233-7.
crossref pmid
7) Praveen MR, Shah GD, Vasavada AR, et al. Posterior capsule opacification in eyes with steroid-induced cataracts: comparison of early results. J Cataract Refract Surg 2011;37:88-96.
crossref pmid
8) Watson D, Noble MJ, Dutton GN, et al. Penetration of topically applied dexamethasone alcohol into human aqueous humor. Arch Ophthalmol 1988;106:686-7.
crossref pmid
9) Hyndiuk RA, Reagan MG. Radioactive depot-corticosteroid penetration into monkey ocular tissue. I. Retrobulbar and systemic administration. Arch Ophthalmol 1968;80:499-503.
crossref pmid
10) Best JH, Kong AM, Lenhart GM, et al. Association between glucocorticoid exposure and healthcare expenditures for potential glucocorticoid-related adverse events in patients with rheumatoid arthritis. J Rheumatol 2018;45:320-8.
crossref pmid
11) Nath T, Roy SS, Kumar H, et al. Prevalence of steroid-induced cataract and glaucoma in chronic obstructive pulmonary disease patients attending a tertiary care center in India. Asia Pac J Ophthalmol (Phila) 2017;6:8-32.
crossref pmid
12) James ER, Robertson L, Ehlert E, et al. Presence of a transcriptionally active glucocorticoid receptor alpha in lens epithelial cells. Invest Ophthalmol Vis Sci 2003;44:5269-76.
crossref pmid
13) Lyu J, Kim JA, Chung SK, et al. Alteration of cadherin in dexamethasone-induced cataract organ-cultured rat lens. Invest Ophthalmol Vis Sci 2003;44:2034-40.
crossref pmid
14) Gupta V, Wagner BJ. Expression of the functional glucocorticoid receptor in mouse and human lens epithelial cells. Invest Ophthalmol Vis Sci 2003;44:2041-6.
crossref pmid
15) Eshaghian J, Streeten BW. Human posterior subcapsular cataract. An ultrastructural study of the posteriorly migrating cells. Arch Ophthalmol 1980;98:134-43.
crossref pmid
16) Sue Menko A. Lens epithelial cell differentiation. Exp Eye Res 2002;75:485-90.
crossref pmid
17) Chamberlain CG, McAvoy JW. Induction of lens fibre differentiation by acidic and basic fibroblast growth factor (FGF). Growth Factors 1989;1:125-34.
crossref pmid
18) Ibaraki N, Lin LR, Reddy VN. Effects of growth factors on proliferation and differentiation in human lens epithelial cells in early subculture. Invest Ophthalmol Vis Sci 1995;36:2304-12.
pmid
19) Reneker LW, Overbeek PA. Lens-specific expression of PDGF-A alters lens growth and development. Dev Biol 1996;180:554-65.
crossref pmid
20) Leenders WP, van Genesen ST, Schoenmakers JG, et al. Synergism between temporally distinct growth factors: bFGF, insulin, and lens cell differentiation. Mech Dev 1997;67:193-201.
crossref pmid
21) Klok E, Lubsen NH, Chamberlain CG, McAvoy JW. Induction and maintenance of differentiation of rat lens epithelium by FGF-2, insulin, and IGF-1. Exp Eye Res 1998;67:425-31.
crossref pmid
22) Bhuyan DK, Reddy PG, Bhuyan KC. Growth factor receptor gene and protein expressions in the human lens. Mech Ageing Dev 2000;113:205-18.
crossref pmid
23) Collison DJ, Duncan G. Regional differences in functional receptor distribution and calcium mobilization in the intact human lens. Invest Ophthalmol Vis Sci 2001;42:2355-63.
pmid
24) de Iongh RU, Gordon-Thomson C, Chamberlain CG, et al. TGFbeta receptor expression in lens: Implications for differentiation and cataractogenesis. Exp Eye Res 2001;72:649-59.
crossref pmid
25) de Iongh RU, Lovicu FJ, Overbeek PA, et al. Requirement for TGFbeta receptor signaling during terminal lens fiber differentiation. Development 2001;128:3995-4010.
pmid
26) Le AC, Musil LS. FGF signaling in chick lens development. Dev Biol 2001;233:394-411.
crossref pmid
27) Lovicu FJ, McAvoy JW. FGF-induced lens cell proliferation and differentiation is dependent on MAPK (ERK1/2) signalling. Development 2001;128:5075-84.
crossref pmid pdf
28) Ghinelli E, Aloe L, Cortes M, et al. Nerve growth factor (NGF) and lenses: effects of NGF in an in vitro rat model of cataract. Graefes Arch Clin Exp Ophthalmol 2003;241:845-51.
crossref pmid
29) Gato A, Martin C, Alonso MI, et al. Chondroitin sulphate proteoglycan is involved in lens vesicle morphogenesis in chick embryos. Exp Eye Res 2001;73:469-78.
crossref pmid
30) Inatani M, Tanihara H, Oohira A, et al. Neuroglycan C, a neural tissue-specific transmembrane chondroitin sulfate proteoglycan, in retinal neural network formation. Invest Ophthalmol Vis Sci 2000;41:4338-46.
pmid
31) Escher P, Cottet S, Aono S, et al. Differential neuroglycan C expression during retinal degeneration in Rpe65-/- mice. Mol Vis 2008;14:2126-35.
pmid pmc
32) Cottet S, Jüttner R, Voirol N, et al. Retinal pigment epithelium protein of 65 kDA gene-linked retinal degeneration is not modulated by chicken acidic leucine-rich epidermal growth factor-like domain containing brain protein/Neuroglycan C/chondroitin sulfate proteoglycan 5. Mol Vis 2013;19:2312-20.
pmid pmc
33) Li H, Mao Y, Bouaziz M, et al. Lens differentiation is controlled by the balance between PDGF and FGF signaling. PLoS Biol 2019;17:e3000133.
crossref pmid pmc
34) Kurose H, Bito T, Adachi T, et al. Expression of fibroblast growth factor 19 (Fgf19) during chicken embryogenesis and eye development, compared with Fgf15 expression in the mouse. Gene Expr Patterns 2004;4:687-93.
crossref pmid
35) Francisco-Morcillo J, Sánchez-Calderón H, Kawakami Y, et al. Expression of Fgf19 in the developing chick eye. Brain Res Dev Brain Res 2005;156:104-9.
crossref pmid
36) Kurose H, Okamoto M, Shimizu M, et al. FGF19-FGFR4 signaling elaborates lens induction with the FGF8-L-Maf cascade in the chick embryo. Dev Growth Differ 2005;47:213-23.
crossref pmid
37) Nakayama Y, Miyake A, Nakagawa Y, et al. Fgf19 is required for zebrafish lens and retina development. Dev Biol 2008;313:752-66.
crossref pmid

Biography

유웅선 / Woong-Sun Yoo
경상대학교 의과대학 경상대학교병원 안과학교실
Department of Ophthalmology, Gyeongsang National University Hospital, Gyeongsang National University College of Medicine
jkos-2020-61-5-472i1.jpg


ABOUT
BROWSE ARTICLES
EDITORIAL POLICY
FOR CONTRIBUTORS
Editorial Office
SKY 1004 Building #701
50-1 Jungnim-ro, Jung-gu, Seoul 04508, Korea
Tel: +82-2-583-6520    Fax: +82-2-583-6521    E-mail: kos08@ophthalmology.org                

Copyright © 2024 by Korean Ophthalmological Society.

Developed in M2PI

Close layer
prev next