


당뇨황반부종은 당뇨 환자의 7.5%에서 15.7%에서 발생하며[1], 당뇨황반부종 환자의 약 50%는 진단 후 2년 이내에 early treatment diabetic retinopathy study 시력표 2줄 이상의 시력저하를 보일 만큼[2] 당뇨환자에서 시력저하의 주요한 원인 중 하나이다. 당뇨황반부종은 고혈당과 염증 물질 및 혈관내피성장인자(vascular endothelial growth factor)의 축적으로 인하여 혈액 망막 장벽이 손상되고, 혈관 투과성이 증가하여 발생한다[3]. 당뇨황반부종을 악화시키는 요인으로는 만성적인 고혈당 및 당뇨 유병 기간[4,5], 이상지질혈증[6], 염증[7] 등이 알려져 있다.
최근 다양한 당뇨 치료제의 개발로 환자들의 혈당을 효과적으로 낮출 수 있게 되었지만 환자의 사망률은 오히려 증가하였다는 보고가 있는데, 이는 저혈당과 뒤이어 발생하는 고혈당으로 혈당의 변동폭이 커서 조직에 손상을 줄 수 있음을 시사한다[8]. 지속적인 만성 고혈당뿐 아니라, 일시적으로 혈당이 갑자기 상승하는 경우에도 높은 산화 스트레스로 인해 후성 유전 변이가 발생할 수 있으며[9], 혈당의 심한 변동은 미세혈관의 내피세포 기능에 손상을 일으킬 수 있다[10]. 따라서 혈당이 오르내림을 반복할 경우 내피세포 기능의 장애를 유발하고 혈관벽에 변화를 일으킬 수 있음이 보고되었다[11,12]. 또한 이러한 이유로 혈당의 변동성이 당뇨 환자에서 콩팥병증 및 심혈관계 질환의 진행에 영향을 준다는 것이 보고되었다[13-18].
당뇨망막병증에서도 혈당의 변동성이 질환의 발생 및 진행과 관련이 있는 것으로 알려져 있다[19]. Hietala et al [20]은 제1형 당뇨병 환자에서 혈당의 변동성이 높을수록 레이저 치료가 필요한 당뇨망막병증의 발생 위험이 증가한다고 하였으며, Hermann et al [21]은 제1형 당뇨병 환자에서 혈당의 변동성이 높을수록 당뇨망막병증의 위험이 증가한다고 하였다. 그러나 아직까지 혈당의 변동성이 당뇨황반부종의 발생 및 치료에 미치는 영향에 대해서는 연구가 부족하다.
당뇨황반부종 또한 혈액 망막 장벽이 손상되며 혈관 투과성이 증가되어 발생하는 것으로, 혈당의 변동성에 따른 내피세포 손상 및 혈관벽 변화로 인하여 당뇨황반부종이 악화될 가능성이 있다. 따라서 본 연구에서는 혈당의 변동성이 당뇨황반부종의 안구 내 항혈관내피성장인자항체 주사 치료 효과에 미치는 영향을 분석하여 임상진료에서 당뇨황반부종의 주사 치료 효과를 예측하는 데에 도움이 되고자 하였다.
대상과 방법
2013년 1월부터 2019년 12월까지 당뇨황반부종으로 안구 내 항혈관내피성장인자항체 주사 치료를 받은 환자들 중 선별된 49안(38명)의 의무기록을 후향적으로 분석하였다. 환자들의 주사 치료 전후 혈당을 포함한 전신 상태 및 시력, 황반부두께 등 안과 소견을 조사하였다. 항혈관내피성장인자항체 주사에는 베바시주맙(Avastin®, Genetech, South San Francisco, CA, USA), 라니비주맙(Lucentis®, Genentech), 애플리버셉트(Eylea®, Regeneron, Tarrytown, NY, USA)가 포함되었다. 선정 기준은 당뇨황반부종으로 안구 내 항혈관내피성장인자항체 주사를 시행받은 환자 중 해당 주사 치료 이전 6개월 간 주사 치료를 시행 받지 않았던 환자로 하였다. 또한 당화혈색소(Hemoglobin A1c, HbA1c)의 변동성을 보기 위하여 해당 주사 이전 1년간 그리고 주사 이후 1년간 각각 당화혈색소 혈액검사를 4회 이상 시행한 기록이 있는 환자를 대상으로 하였다. 해당 주사 전후 6개월 이내에 안구 내 수술을 시행 받은 환자, 주사 시점 이전에 합병증 없이 시행된 백내장 수술 외에 다른 안구 내 수술을 받은 환자는 제외하였다.
주사 치료 효과는 주사 치료 전후 빛간섭단층촬영의 중심황반두께 및 최대교정시력으로 평가하였다. 빛간섭단층촬영 장치는 스펙트럼 영역 빛간섭단층촬영 장치(Spectralis OCT; Heidelberg Engineering Inc., Heidelberg, Germany)가 사용되었다. 최대교정시력은 한천석 3미터 시력표(2016년도)를 이용하여 측정된 값을 logarithm of the minimum angle of resolution (logMAR) 시력으로 환산하였다.
황반부종은 이전 문헌을 참고하여 빛간섭단층촬영 결과에 따라 스폰지형 광범위 망막부종, 낭성황반부종, 그리고 장액망막박리와 함께 다른 유형이 동반된 경우, 총 3가지로 분류하였다[22].
주사 시점을 기준으로 주사 직전 및 주사 후 1, 6개월의 최대교정시력과 중심황반두께의 변화를 분석하였고, 주사 시행 전후 3개월 이내에 시행한 혈액검사수치(creatinine, blood urea nitrogen [BUN], estimated glomerular filtration rate [eGFR], total cholesterol, low-density lipoproteins [LDL], high-density lipoproteins [HDL], triglycerides [TG], hemoglobin [Hb])를 조사하여 주사 시점의 전신 상태를 분석하였다.
혈액검사수치 중 당화혈색소는 주사 시점 이전 1년간 시행한 4회 이상의 검사 결과값 및 주사 시점 이후 1년간 시행한 4회 이상의 검사 결과값을 조사하였으며, 각각의 당화혈색소 수치의 변동 계수값(coefficient of variation, CV)으로 혈당의 변동성을 평가하였다(CV=standard deviation of HbA1c/mean HbA1c). 또한 매 방문 시 측정한 당화혈색소 수치를 직전 검사 결과와 비교하여 그 변화 정도를 계산하고, 환자마다 이러한 변화 정도의 최대값 및 최소값을 구하여 비교 분석하였다. 혈당 변동성과 평균 혈당에 따른 주사 치료 효과 및 기타 인자들을 비교하기 위하여 당화혈색소 중간값(7.9%)과 당화혈색소 변동계수(HbA1c-CV)의 중간값(0.091)을 기준으로 각각 2군으로 나누어 총 4군으로 분류하였다. 최근 American College of Physicians에서 제시한 glucose control guidance에서는 성인 제 2형 당뇨병 환자에서 당화혈색소를 7%에서 8% 사이로 조절하는 것이 적합하다고 발표하였다[23]. 따라서 본 연구에서 당화혈색소 중간값인 7.9% 이하로 조절되는 환자의 경우 당뇨 조절 상태가 양호하다고 판단하였다. 당화혈색소 변동계수의 경우 아직까지 정상과 비정상에 대한 명확한 기준이 없으며, 이전의 관련된 연구에서도 환자를 전체 값의 중간값 또는 삼, 사분위수로 나누어 비교 분석하였다. 본 연구에서는 전체 환자들의 당화혈색소 변동계수의 중간값을 기준으로 환자를 분류하여 비교 분석하고자 하였다. 당화혈색소 평균값이 낮은 군과 높은 군 각각에서 변동계수가 낮은 군과 높은 군의 특성을 비교하였고, Mann-Whitney U 검정을 이용하여 분석하였다.
또한 당뇨황반부종의 주사 치료 효과에 영향을 미치는 인자들을 알아보기 위해 나이, 과거 치료력, 주사약제 종류, 당화혈색소 변동계수를 포함한 혈액수치, 중심황반두께, 시력 등을 이용하여 다변량 분석(Cox regression analysis)을 시행하였다. 주사 약제는 총 3가지로, 약제 종류에 따라 주사 효과에 차이가 발생할 가능성을 고려하여 주사 약제에 따른 기본 특성 및 주사 효과를 분석하였다. 분석 결과 약제 종류에 따른 유의한 차이는 없었으며, 라니비주맙군의 경우 2안으로 적은 숫자의 환자가 포함되었고, 애플리버셉트군과 임상정보의 유의한 차이가 없어 한 군으로 묶어 분석하였다. 주사 효과를 보는 회귀분석에는 이러한 주사 약제 종류가 변수로 포함되었다. 통계분석은 IBM SPSS ver. 18.0 (SPSS Inc., Chicago, IL, USA)을 이용하였으며, p값이 0.05 미만인 경우 통계학적으로 유의한 것으로 간주하였다. 본 연구는 생명윤리위원회의 승인(IRB 승인 번호: 2019-05-002)을 받아 진행되었다.
결 과
총 38명(49안)의 환자(남성 25명, 여성 13명)가 연구에 포함되었다. 평균 연령은 58.5 ± 11.4세였으며 당화혈색소 평균값은 7.9 ± 1.2%, 평균 당화혈색소 변동계수는 0.1 ± 0.1이었다. 포함된 환자들 중 증식당뇨망막병증 환자가 28안으로 가장 많았으며, 경도의 비증식당뇨망막병증이 2안, 중등도 비증식당뇨망막병증이 7안, 심한 비증식당뇨망막병증이 12안 포함되었다. 당뇨황반부종으로 주사 치료를 받은 시점의 중심황반두께(central macular thickness, CMT)는 평균 401.7 ± 125.9 μm였으며, 유리체강 내 베바시주맙 주사가 35안(71.4%), 애플리버셉트 주사가 12안(24.5%), 라니비주맙 주사가 2안(4.1%) 포함되었다(Table 1).
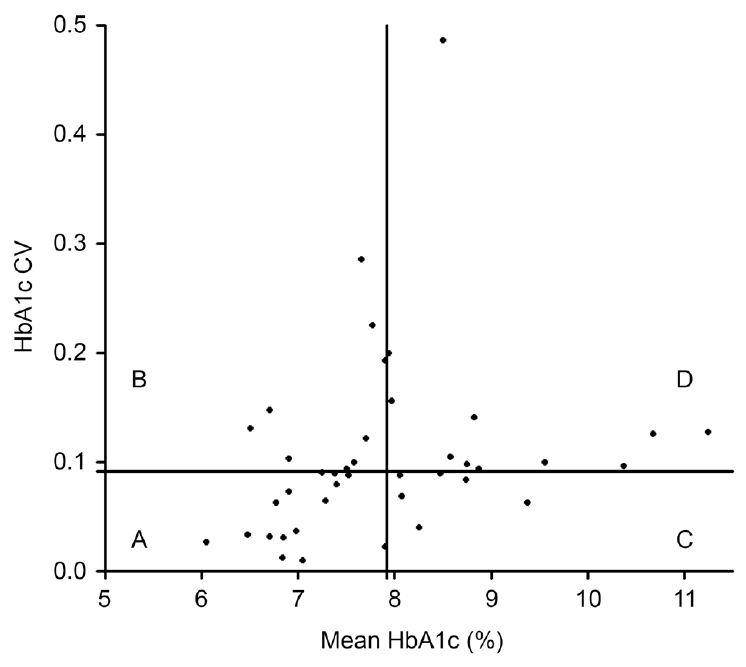
전체 대상 안을 당화혈색소 중간값과 당화혈색소 변동계수값의 중간값을 기준으로 각각 2군으로 나누어 총 4군으로 분류하였다. A군은 당화혈색소 평균값 및 변동계수값이 낮은 군으로, 평균적으로 당화혈색소가 낮으면서 변동성도 적게 잘 유지되는 군(n=18)이었으며, B군은 당화혈색소 평균값은 낮으나 변동성이 비교적 심하여 변동계수값이 높은 군(n=10)이었다. C군은 당화혈색소 평균값은 높으나 변동성은 비교적 낮게 유지되는 군(n=10), D군은 당화혈색소 평균값도 높으면서 변동성도 높은 군(n=11)으로 분류하였다(Fig. 1).
당화혈색소 평균값과 당화혈색소 변동계수 사이에는 유의한 상관관계를 보이지 않았으며(Pearson’s correlation test, r=0.221, p=0.126), 주사 이전 1년간의 당화혈색소 변동성과 주사 이후 1년간의 당화혈색소 변동성은 유의한 차이 없이 주사 전후로 비슷하게 유지되었다(paired t-test, CV-pre-injection 0.1 ± 0.08, CV-post-injection 0.1 ± 0.06, p=0.347).
당화혈색소 변동계수가 컸던 B군과 D군에서는 변동계수가 작았던 A군과 C군에 비해 매 방문시마다 직전 검사치와 비교한 당화혈색소 변화량의 최대 감소값이 유의하게 컸다(A군 0.7 ± 0.7% vs. B군 2.0 ± 1.0%, p=0.001; C군 1.3 ± 0.8% vs. D군 3.1 ± 1.9%, p=0.006). 반면, 당화혈색소 변화의 최대 증가값은 각 군 간에 유의한 차이가 없었다(A군 0.8 ± 0.6% vs. B군 1.4 ± 1.2%, p=0.121; C군 1.2 ± 0.4% vs. D군 1.6 ± 0.7%, p=0.132). 4군 간 특성을 살펴보면, 각 군의 평균 연령은 유의한 차이를 보이지 않았으며 해당 주사 치료 이전에 시행한 과거 주사 횟수 또한 각각 유의한 차이를 보이지 않았다. 당화혈색소 평균이 낮은 A군과 B군 간에는 혈중 신기능 관련 수치(BUN, Creatinine, eGFR) 및 혈중 콜레스테롤 수치(total cholesterol, LDL, HDL, TG) 모두 유의한 차이를 보이지 않았다. 반면, 당화혈색소 평균이 높은 두 군 중에는 변동계수가 높은 D군에서 총 콜레스테롤(C군 140.3 ± 34.3 mg/dL, D군 195.5 ± 45.3 mg/dL, p=0.006) 및 저밀도 지단백(C군 88.2 ± 24.9 mg/dL, D군 118.5 ± 28.3 mg/dL, p=0.013)이 유의하게 높았다. 주사 직전 초기 중심황반두께는 당화혈색소 평균값이 낮은 두 군에서 유의한 차이를 보이지 않았으며(A군 436.9 ± 140.6 μm, B군 394.2 ± 103.0 μm, p=0.495), 당화혈색소 평균이 높은 두 군 간 또한 유의한 차이를 보이지 않았다(C군 421.3 ± 145.6 μm, D군 331.7 ± 68.8 μm, p=0.061). 주사 직전과 주사 이후 1개월의 중심황반두께의 차이(CMT difference, CMTD)는 당화혈색소 평균값이 높은 C군과 D군에서는 당화혈색소 변동성에 따른 유의한 차이가 없었으나(C군 29.5 ± 72.1 μm, D군 43.2 ± 63.2μm, p=0.557), 당화혈색소 평균값이 낮은 A군과 B군에서는 당화혈색소 변동성이 낮은 군에서 1개월째 중심황반두께가 많이 감소하였다(A군 122.4 ± 123.2 μm, B군 5.2 ± 37.0 μm, p=0.027) (Table 2).
주사 직전에 비하여 주사 이후 1개월의 중심황반두께 감소 정도는 주사 직전 중심황반두께(baseline CMT)와 유의한 상관관계를 보였다. 단변량 회귀분석에서는 이전 주사 횟수, 초기 중심황반두께가 유의한 연관성을 보였다. 그러나 다변량 회귀분석에서는 초기 중심황반두께만 유의한 연관성을 보였는데, 주사 직전 중심황반두께가 두꺼울수록 주사 이후 황반두께가 많이 감소하였다(adjusted hazard ratio [aHR] 0.5, p<0.001). 다변량 회귀분석에서 주사 이후 1개월째의 시력호전 정도(visual gain)와 유의한 관련을 보인 것은 초기 시력(baseline BCVA)으로, 초기 시력이 낮을수록 시력호전 정도가 컸다(aHR 0.395, p<0.001) (Table 3).
주사 치료 6개월째의 임상결과와 관련된 인자들에 대한 분석에서는, 주사 전 초기 중심황반두께가 두꺼울수록 주사 이후 6개월째에 중심황반두께가 더 많이 감소하였으며(aHR 0.3, p=0.023), 주사 직전 교정시력이 나쁠수록 주사 이후 시력호전 정도가 컸다(aHR 0.405, p<0.001). 당화혈색소 수치 및 당화혈색소 변동성은 1개월째 및 6개월째 모두에서 중심황반두께의 감소 정도 및 시력호전 정도와 유의한 상관관계가 없었다. 신기능 및 콜레스테롤 관련 수치 또한 중심황반두께의 감소 정도 및 시력호전 정도와 유의한 상관관계를 보이지 않았다(Table 3, 4).
고 찰
본 연구에서는 당뇨황반부종으로 항혈관내피성장인자항체 주사 치료를 받은 제2형 당뇨환자를 대상으로 주사 치료 전후 1년간의 혈당 조절 상태, 혈당의 변동 폭이 당뇨황반부종 주사 치료의 치료 효과와 관련성이 있는지 살펴보았다. 당뇨황반부종 후 황반부종 감소 정도나 시력호전 정도와 관련성을 보인 인자는 주사 전 초기 황반부두께 및 시력이었으며, 평균 당화혈색소 및 당화혈색소 변동계수는 주사 치료 효과와 직접적인 관련성을 보이지는 않았다.
본 연구에서 당화혈색소 변동성은 평균 당화혈색소 수치 자체와 상관관계를 보이지 않았으며(r=0.221, p=0.126), 주사 치료 전후 당화혈색소 변동성 또한 유의한 상관관계를 보이지 않았다(r=0.285, p=0.347). 특히, 평균 혈당이 낮은 두 군(A군 및 B군)에서는 주사 치료 전 혈당 변동성은 유의한 차이를 보였지만(A군 0.05 ± 0.03, B군 0.15 ± 0.06, p<0.001), 주사 치료 이후에는 두 군 모두 낮은 변동성을 보여, B군의 경우 주사 치료 이후에는 혈당이 안정적으로 조절되었음을 알 수 있다(A군 0.06 ± 0.04, B군 0.07 ± 0.04, p=0.308). 이러한 점은 주사 치료 1개월째에는 중심황반두께 감소 정도가 B군에 비해 A군에서 더 컸지만, 6개월째에는 A군과 B군의 중심황반두께 감소 정도의 차이가 없어진 원인일 수 있다.
본 연구에서 분석에 이용한 당화혈색소 변동계수(HbA1c CV)값은 별도의 계산이 필요하기에, 임상에서 보다 쉽게 알아볼 수 있도록 매 방문 시 직전 당화혈색소 검사값과의 차이값을 함께 분석하였다. 변동계수가 큰 군은 작은 군에 비해 직전 검사 대비 당화혈색소 수치의 증가폭 및 감소폭이 큰 경향을 보였으며, 특히 최대 감소값 및 변화량의 절대값의 최대값이 유의하게 큰 것을 확인할 수 있었다. 평균 당화혈색소 수치가 7.9% 이하로 낮았던 군에서 변동계수가 0.091보다 컸던 군의 직전 검사 대비 당화혈색소 수치의 최대 감소폭은 평균 2.0%였으며, 평균 당화혈색소 수치가 7.9% 이상으로 높았던 군에서 변동계수가 0.091보다 컸던 군의 직전 검사 대비 당화혈색소 수치의 최대 감소폭은 평균 3.1%였다. 본 연구에서 장기간 당화혈색소의 증가와 감소를 반영하기 위하여 변동계수를 사용하였으나, 실제로 본 연구에는 급격한 혈당의 상승보다는 당뇨가 조절되지 않다가 내과적 치료 이후 단기간 내에 혈당이 낮아진 환자들이 많이 포함되었음을 알 수 있다. 이러한 특성이 당화혈색소 변동계수와 주사 치료 효과 사이의 유의한 연관성이 없었던 이유가 될 수 있다.
당화혈색소 변동성과 당뇨망막병증 사이의 연관성에 대해서는, 많은 연구가 진행되었지만 아직 확실한 연관성에 대한 근거는 부족하다. Gimeno-Orna et al [24]에 의하면 제2형 당뇨병 환자 130명을 대상으로 평균 5.2년간 관찰하였을 때 공복 혈당의 변동성이 높을수록 당뇨망막병증의 발생 위험이 높아진다고 하였다. Hermann et al [21]은 제1형 당뇨병 환자 35,891명을 대상으로 당뇨망막병증의 발생을 조사하였고, 당화혈색소 변동성이 당뇨망막병증 발생의 독립적인 위험 요인으로 작용한다고 하였다. 반면 Penno et al [25]은 8,260명의 제2형 당뇨병 환자들의 당화혈색소 변동성과 당뇨망막병증 및 신부전 여부를 분석하였고, 신부전 여부는 당화혈색소 변동성과 연관성이 있는 것에 비해, 당뇨망막병증 여부는 당화혈색소 변동성과 연관이 없다고 하였다.
당화혈색소 변동성과 당뇨황반부종과의 관련성에 대한 연구는 제한적이었으나, 당화혈색소 평균값과 당뇨황반부종에 대한 연구는 보고된 바가 있다. Chou et al [26]은 102명의 당뇨황반부종 환자에서, 당화혈색소 평균값이 8.0% 이상인 경우 8.0% 미만인 경우에 비해 당뇨황반부종의 정도가 유의하게 증가한다고 하였다. 97명의 당뇨환자를 대상으로 시행된 다른 연구에서는, 이전 1년간의 당화혈색소 평균값이 높을수록 중심황반두께가 두껍다고 보고하였다[27]. Moon et al [28]은 23명의 당뇨환자를 대상으로 1년 이내 2회의 당화혈색소 검사 수치와 2회의 중심황반두께를 측정하여 분석하였고, 당화혈색소 초기값이 높을수록, 당화혈색소의 변화 정도가 클수록 중심황반두께의 증가 정도가 크다고 하였다. 이 연구는 본 연구에서처럼 당화혈색소의 변동과 황반부종의 관계를 분석하였으나, 단 2회의 당화혈색소 수치의 차이값을 반영하였으며 주사 치료 없이 황반부종의 자연 경과를 보았다는 차이점이 있다. 본 연구에서 초기 중심황반두께는 당화혈색소 평균값(r=-0.252, p=0.087) 및 당화혈색소 변동성(r=-0.150, p=0.321)과 유의한 연관이 없었다.
본 연구에서 평균 당화혈색소 수치 및 당화혈색소 변동성은 주사 치료 효과와 유의한 차이를 보이지 않았다. 주사 치료에 관련된 이전 연구에서는 당화혈색소 평균값에 따라 주사의 효과에 차이가 없었다는 점에서 본 연구와 일치하는 결과를 보였다. Singh et al [29]은 당뇨황반부종 환자에서 유리체강 내 애플리버셉트주입술을 시행한 경우, 당화혈색소 평균값에 따른 치료 효과의 차이는 없다고 보고하였다. 하지만 레이저광응고술을 시행하는 경우 당화혈색소 수치가 낮을수록 시력과 중심황반두께가 호전되었다[29]. 라니비주맙 주사의 경우에도, 당뇨황반부종 환자에서 주사 효과와 당화혈색소 수치 간에는 유의한 연관이 없었다고 보고하였다[30,31]. 이처럼 평균 당화혈색소 수치와 당뇨황반부종 정도 및 항혈관내피성장인자항체 주사 치료 효과와의 관련성에 대한 연구는 제한적으로나마 이루어져 왔으나, 아직 당화혈색소의 변동성과 당뇨황반부종의 치료 효과 간의 관련성을 본 연구는 찾기 어려웠다.
본 연구에서는 주사 이후 1개월과 6개월의 치료 효과를 평가하였는데, 1개월 및 6개월 이후 주사 치료 효과와 유의한 연관이 있는 인자는 초기 중심황반두께 및 초기 시력이었다. 초기 황반부종이 심할수록 주사 이후 황반부종의 감소 정도가 컸으며, 초기 시력이 나쁠수록 주사 이후 시력호전 정도가 컸다. 이는 이전 연구들과 일치하는 결과로, 12개월간 당뇨황반부종의 치료로 라니비주맙 단일 치료의 효과를 분석한 논문에서는 초기 시력이 낮을수록, 초기 중심황반두께가 두꺼울수록 12개월 후 시력호전 정도 및 중심황반두께 감소 정도가 크다고 하였다. 반면, 당화혈색소 수치 및 연령은 주사 효과와 연관이 없었다[32]. 당뇨황반부종의 유형에 따른 덱사메타손삽입물의 치료 효과를 분석한 한 논문에서는 초기 시력이 나쁠수록 주사 후 3개월째 시력호전 정도가 크다고 보고하였다[33]. 당뇨황반부종에서의 트리암시놀론 주사 효과에 관한 다른 연구에서도, 초기 시력이 나쁠수록 3개월째의 시력호전 정도가 컸다[34].
본 연구에서는 당화혈색소 수치 이외에 다양한 혈액검사 소견을 함께 조사하여 당뇨황반부종 치료 효과와 비교하였다. 기존 연구들에서는 신기능이 나쁠수록 당뇨망막병증의 발생 및 진행 정도는 증가할 수 있지만, 신기능과 당뇨황반부종의 발생과는 연관성이 없다고 하였다[35,36]. 신기능과 당뇨황반부종의 라니비주맙 주사 효과를 본 논문에서는, 97안을 대상으로 주사 후 3개월째에 중심황반두께 감소 정도는 신기능과 연관이 없다고 하였다[37]. 본 연구에서도 신기능과 주사 전후 중심황반두께는 유의한 관련성이 없는 것으로 나타났다. 하지만 본 연구는 적은 숫자의 환자를 대상으로 진행되었으며, 대부분 환자의 신기능은 정상이었고 신기능이 나쁜 소수 환자의 eGFR값이 극단으로 치우쳐 있어서 정확한 평가가 이루어졌다고 보기 어렵다.
Das et al [38]은 이상지질혈증과 당뇨황반부종에 대한 21개의 논문을 분석하여 총 콜레스테롤, 저밀도 지단백, 중성지방 수치가 당뇨황반부종의 유무와는 관련이 있으나, 이상 지질혈증의 치료 정도와 당뇨황반부종의 정도는 관련이 없다고 하였다. Benarous et al [39]은 500명의 환자를 분석하여 혈청 지질 농도는 임상적으로 유의한 황반부종과는 연관이 있으나 당뇨황반부종 여부와는 연관이 없다고 하였다. 본 연구에서도 초기 당뇨황반부종 정도와 총 콜레스테롤(r=-0.017, p=0.908), 저밀도 지단백(r=-0.043, p=0.779), 중성지방(r=-0.066, p=0.667), 고밀도 지단백(r=0.024, p=0.875) 모두 유의한 연관이 없었다.
본 연구에 포함된 환자들에서는 주사 치료로 인한 해부학적 및 기능적 효과를 관찰할 수 있었지만, 이러한 주사 치료 효과는 혈당의 변동성을 포함한 환자의 전신 상태와 큰 연관이 없었다. 이러한 결과들은 현재의 항혈관내피성장인자항체 주사 치료가 환자의 전신 상태에 크게 구애받지 않고 좋은 효과를 보여줌을 간접적으로 시사한다고 볼 수 있다.
본 연구의 제한점은 첫째, 후향적 연구로 환자들의 다양한 검사 횟수와 검사 간 다양한 시간 간격을 통제할 수 없었다. 따라서 이전 6개월간 주사 치료를 받은 적이 없는 환자 중 주사 전후 1년 간 당화혈색소검사를 4회 이상 시행한 환자들로 선별 기준을 정하여 이를 보완하고자 하였다. 둘째, 주사 날짜 전후 1년간의 혈액검사의 평균값이 당시의 전신 상태를 나타낸다고 보았으나, 주사 시점의 전신 상태의 변동을 정확히 반영하지 못했을 가능성이 있다. 셋째, 당뇨황반부종으로 주사 치료를 받은 환자 중 선별 기준을 만족하는 49안을 대상으로 하였고, 적은 표본 수가 모든 당뇨황반부종 환자를 대표하기에는 한계가 있을 수 있다. 또한 당화혈색소 변동계수가 큰 군에 포함된 환자들이 최근 급격한 혈당 증가를 보인 경우보다는 당 조절이 잘 되지 않다가 내과 치료 이후 급격히 당 수치가 떨어진 경우들이 주로 포함되어, 변동계수의 영향이 작게 반영되었을 수 있다. 넷째, 유리체강내 주사가 여러 약물로 시행되어 약제에 따른 차이가 있을 수 있다. 하지만 약제 종류와 당화혈색소 및 당화혈색소 변동계수 등 기본 특성 및 초기 황반부종, 초기 시력, 주사 효과 등에서 유의한 차이가 없었다. 다변량 분석에서도 주사 약제 종류에 따른 황반부종 치료 효과의 차이는 보이지 않았다.
결론적으로, 장기간 혈당의 변동성은 당뇨황반부종의 주사 치료 효과에 유의한 영향을 미치지 않았다. 본 연구는 실제 임상에서 시행된 주사 치료 결과를 반영하였으며, 심혈관계 질환 및 신기능 질환과 더불어 최근 당뇨망막병증의 진행과도 연관성이 밝혀지고 있는 당화혈색소의 변동성에 대한 주사 효과를 분석하였다는 것에 의미가 있다. 다만, 본 연구에 포함된 환자의 수가 적어 추후 많은 환자에서 이러한 경향이 재현되는지 확인할 필요가 있다.

 PDF Links
 PubReader
 ePub Link
 Full text via DOI
 Download Citation
 Print
Print